29
/it/
it
AIzaSyAYiBZKx7MnpbEhh9jyipgxe19OcubqV5w
April 1, 2024
37793
IDA & IBRD total
IBT
false
2
1
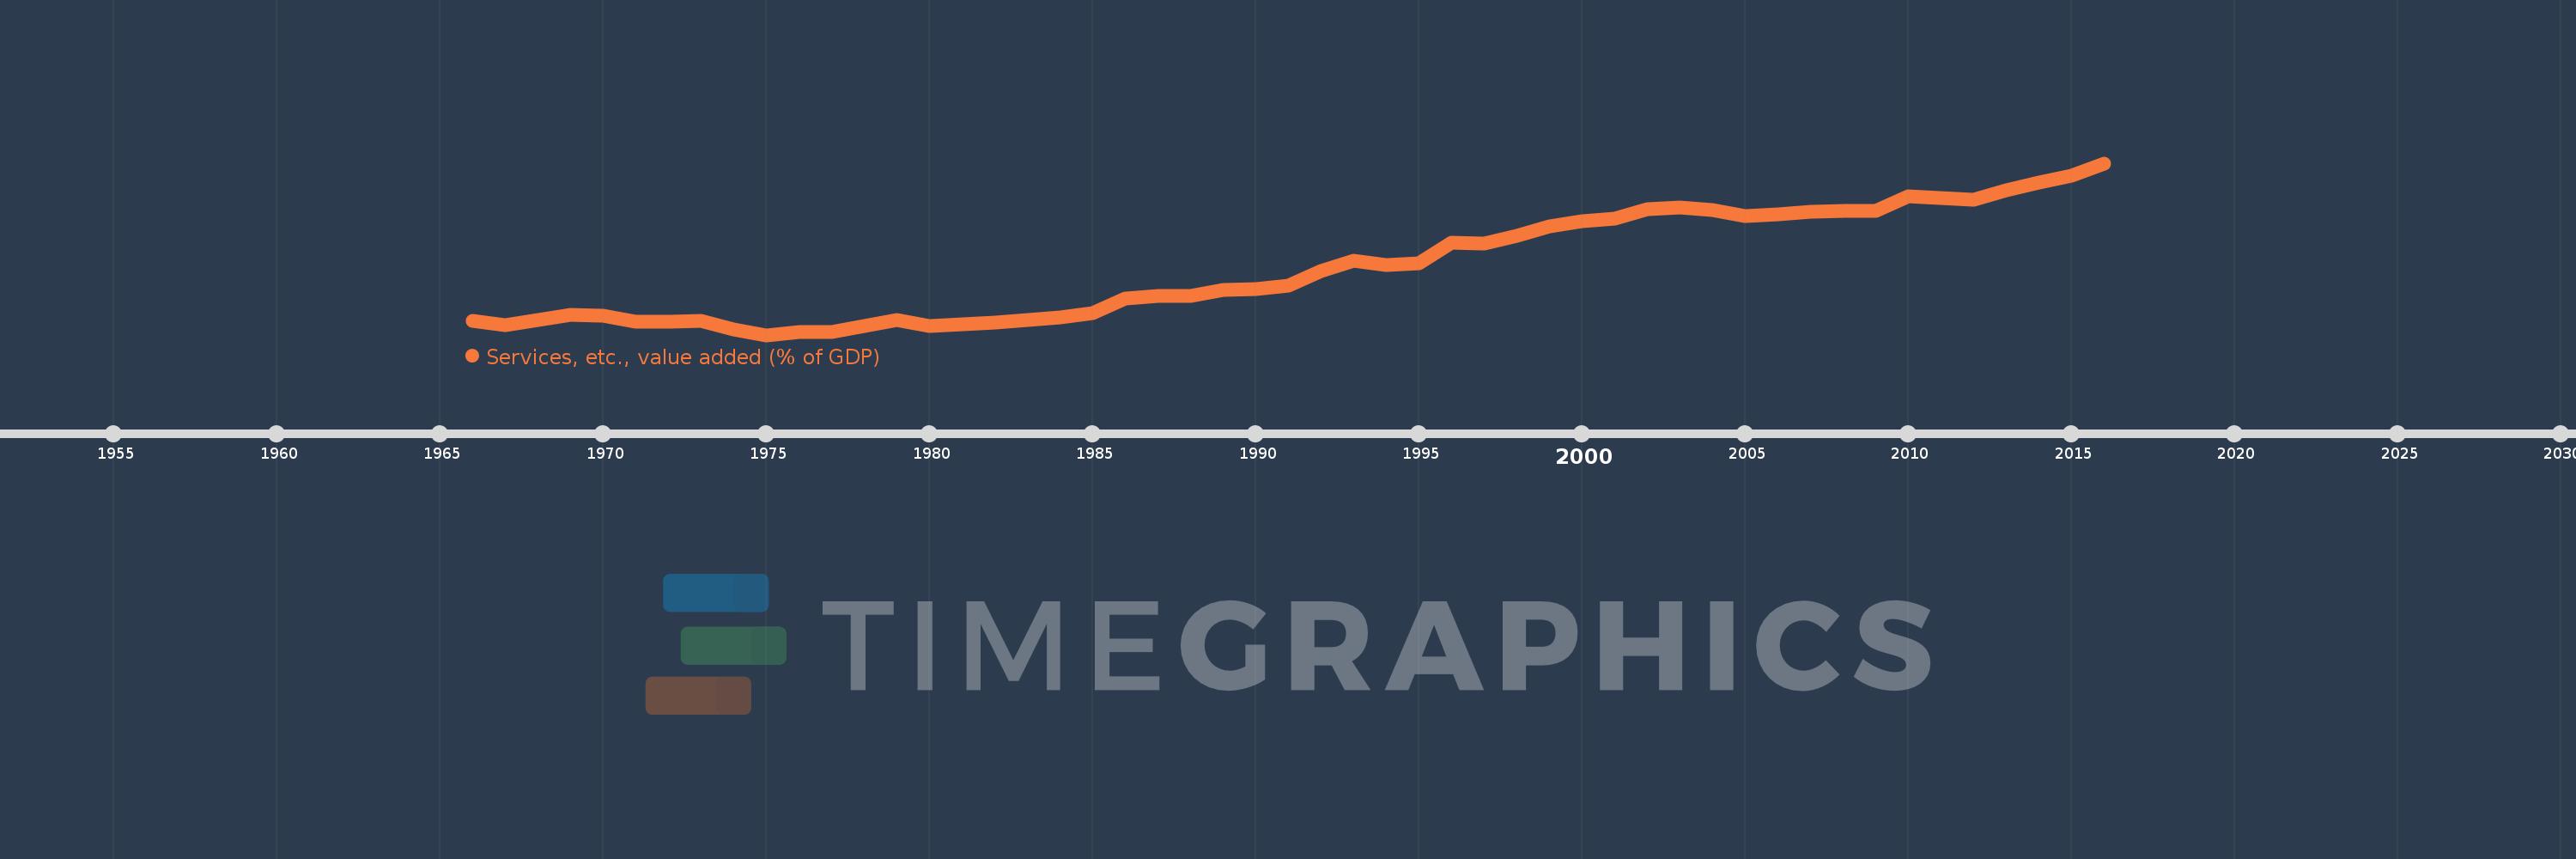
Services, etc., value added (% of GDP)
2016,2015,2014,2013,2012,2011,2010,2009,2008,2007,2006,2005,2004,2003,2002,2001,2000,1999,1998,1997,1996,1995,1994,1993,1992,1991,1990,1989,1988,1987,1986,1985,1984,1983,1982,1981,1980,1979,1978,1977,1976,1975,1974,1973,1972,1971,1970,1969,1968,1967,1966
Queste statistiche in altri paesi:
AfghanistanAlbaniaAlgeriaAndorraAngolaAntigua and BarbudaArab WorldArgentinaArmeniaArubaAustraliaAustriaAzerbaijanBahamas, TheBahrainBangladeshBarbadosBelarusBelgiumBelizeBeninBermudaBhutanBoliviaBosnia and HerzegovinaBotswanaBrazilBrunei DarussalamBulgariaBurkina FasoBurundiCabo VerdeCambodiaCameroonCanadaCaribbean small statesCentral African RepublicCentral Europe and the BalticsChadChileChinaColombiaComorosCongo, Dem. Rep.Congo, Rep.Costa RicaCote d'IvoireCroatiaCubaCyprusCzech RepublicDenmarkDjiboutiDominicaDominican RepublicEarly-demographic dividendEast Asia & PacificEast Asia & Pacific (excluding high income)East Asia & Pacific (IDA & IBRD countries)EcuadorEgypt, Arab Rep.El SalvadorEquatorial GuineaEritreaEstoniaEthiopiaEuro areaEurope & Central AsiaEurope & Central Asia (excluding high income)Europe & Central Asia (IDA & IBRD countries)European UnionFaroe IslandsFijiFinlandFragile and conflict affected situationsFranceGabonGambia, TheGeorgiaGermanyGhanaGreeceGrenadaGuatemalaGuineaGuinea-BissauGuyanaHeavily indebted poor countries (HIPC)High incomeHondurasHong Kong SAR, ChinaHungaryIBRD onlyIcelandIDA & IBRD totalIDA blendIDA onlyIDA totalIndiaIndonesiaIran, Islamic Rep.IrelandItalyJamaicaJapanJordanKazakhstanKenyaKiribatiKorea, Rep.KosovoKuwaitKyrgyz RepublicLao PDRLate-demographic dividendLatin America & Caribbean Latin America & Caribbean (excluding high income)Latin America & the Caribbean (IDA & IBRD countries)LatviaLeast developed countries: UN classificationLebanonLesothoLibyaLithuaniaLow & middle incomeLow incomeLower middle incomeLuxembourgMacao SAR, ChinaMacedonia, FYRMadagascarMalawiMalaysiaMaldivesMaliMaltaMarshall IslandsMauritaniaMauritiusMexicoMicronesia, Fed. Sts.Middle East & North AfricaMiddle East & North Africa (excluding high income)Middle East & North Africa (IDA & IBRD countries)Middle incomeMoldovaMongoliaMontenegroMoroccoMozambiqueMyanmarNamibiaNepalNetherlandsNew CaledoniaNew ZealandNicaraguaNigerNigeriaNorth AmericaNorwayOECD membersOmanOther small statesPacific island small statesPakistanPalauPanamaPapua New GuineaParaguayPeruPhilippinesPolandPortugalPost-demographic dividendPre-demographic dividendPuerto RicoQatarRomaniaRussian FederationRwandaSao Tome and PrincipeSaudi ArabiaSenegalSerbiaSeychellesSierra LeoneSingaporeSlovak RepublicSloveniaSmall statesSolomon IslandsSomaliaSouth AfricaSouth AsiaSouth Asia (IDA & IBRD)SpainSri LankaSt. Kitts and NevisSt. LuciaSt. Vincent and the GrenadinesSub-Saharan Africa Sub-Saharan Africa (excluding high income)Sub-Saharan Africa (IDA & IBRD countries)SudanSurinameSwazilandSwedenSwitzerlandSyrian Arab RepublicTajikistanTanzaniaThailandTimor-LesteTogoTongaTrinidad and TobagoTunisiaTurkeyTurkmenistanTuvaluUgandaUkraineUnited KingdomUnited StatesUpper middle incomeUruguayUzbekistanVanuatuVenezuela, RBVietnamWest Bank and GazaWorldYemen, Rep.ZambiaZimbabwe Linea del tempo:
Questa scala temporale mostra un grafico dal 1966 anno al 2016 anno. IDA & IBRD total. I dati fino ad 1965 anno non disponibili. Il numero di osservazioni attuali secondo i date: 51.
La fonte (nome):
Indicatori dello sviluppo mondiale
La fonte (organizzazione):
World Bank national accounts data, and OECD National Accounts data files.
Categorie:
Economy & Growth
sono stati aggiornati
23 apr 2017 anni
Indicatori delle variazioni dei valori per anni
Minima:
36.141
1 gen 1975 anni
Massimo:
57.262
1 gen 2016 anni
Alla data di osservazione
Valore
Variazione assoluta
La variazione rispetto al valore precedente
1 gen 1966 anni
37.844
+37.844
0.0%
1 gen 1967 anni
37.385
-0.459
-1.21%
1 gen 1968 anni
38.014
+0.63
1.68%
1 gen 1969 anni
38.651
+0.637
1.67%
1 gen 1970 anni
38.475
-0.176
-0.46%
1 gen 1971 anni
37.79
-0.685
-1.78%
1 gen 1972 anni
37.785
-0.005
-0.01%
1 gen 1973 anni
37.859
+0.075
0.2%
1 gen 1974 anni
36.823
-1.036
-2.74%
1 gen 1975 anni
36.141
-0.682
-1.85%
1 gen 1976 anni
36.499
+0.358
0.99%
1 gen 1977 anni
36.525
+0.027
0.07%
1 gen 1978 anni
37.274
+0.748
2.05%
1 gen 1979 anni
38.023
+0.749
2.01%
1 gen 1980 anni
37.295
-0.728
-1.91%
1 gen 1981 anni
37.477
+0.182
0.49%
1 gen 1982 anni
37.68
+0.203
0.54%
1 gen 1983 anni
37.949
+0.269
0.71%
1 gen 1984 anni
38.354
+0.405
1.07%
1 gen 1985 anni
38.793
+0.438
1.14%
1 gen 1986 anni
40.657
+1.865
4.81%
1 gen 1987 anni
40.957
+0.3
0.74%
1 gen 1988 anni
40.927
-0.03
-0.07%
1 gen 1989 anni
41.712
+0.784
1.92%
1 gen 1990 anni
41.76
+0.049
0.12%
1 gen 1991 anni
42.263
+0.503
1.2%
1 gen 1992 anni
43.975
+1.712
4.05%
1 gen 1993 anni
45.265
+1.29
2.93%
1 gen 1994 anni
44.785
-0.48
-1.06%
1 gen 1995 anni
44.944
+0.158
0.35%
1 gen 1996 anni
47.499
+2.555
5.69%
1 gen 1997 anni
47.357
-0.142
-0.3%
1 gen 1998 anni
48.31
+0.954
2.01%
1 gen 1999 anni
49.535
+1.225
2.54%
1 gen 2000 anni
50.154
+0.619
1.25%
1 gen 2001 anni
50.405
+0.25
0.5%
1 gen 2002 anni
51.599
+1.194
2.37%
1 gen 2003 anni
51.842
+0.243
0.47%
1 gen 2004 anni
51.548
-0.294
-0.57%
1 gen 2005 anni
50.81
-0.738
-1.43%
1 gen 2006 anni
50.945
+0.135
0.27%
1 gen 2007 anni
51.254
+0.309
0.61%
1 gen 2008 anni
51.43
+0.175
0.34%
1 gen 2009 anni
51.364
-0.066
-0.13%
1 gen 2010 anni
53.236
+1.872
3.64%
1 gen 2011 anni
52.98
-0.256
-0.48%
1 gen 2012 anni
52.791
-0.189
-0.36%
1 gen 2013 anni
53.9
+1.109
2.1%
1 gen 2014 anni
54.84
+0.94
1.74%
1 gen 2015 anni
55.728
+0.889
1.62%
1 gen 2016 anni
57.262
+1.534
2.75%
Classificazione dei paesi secondo i statistiche attuali per anni


Commenti: