29
/it/
it
AIzaSyAYiBZKx7MnpbEhh9jyipgxe19OcubqV5w
April 1, 2024
246300
South Africa
ZAF
true
2
1
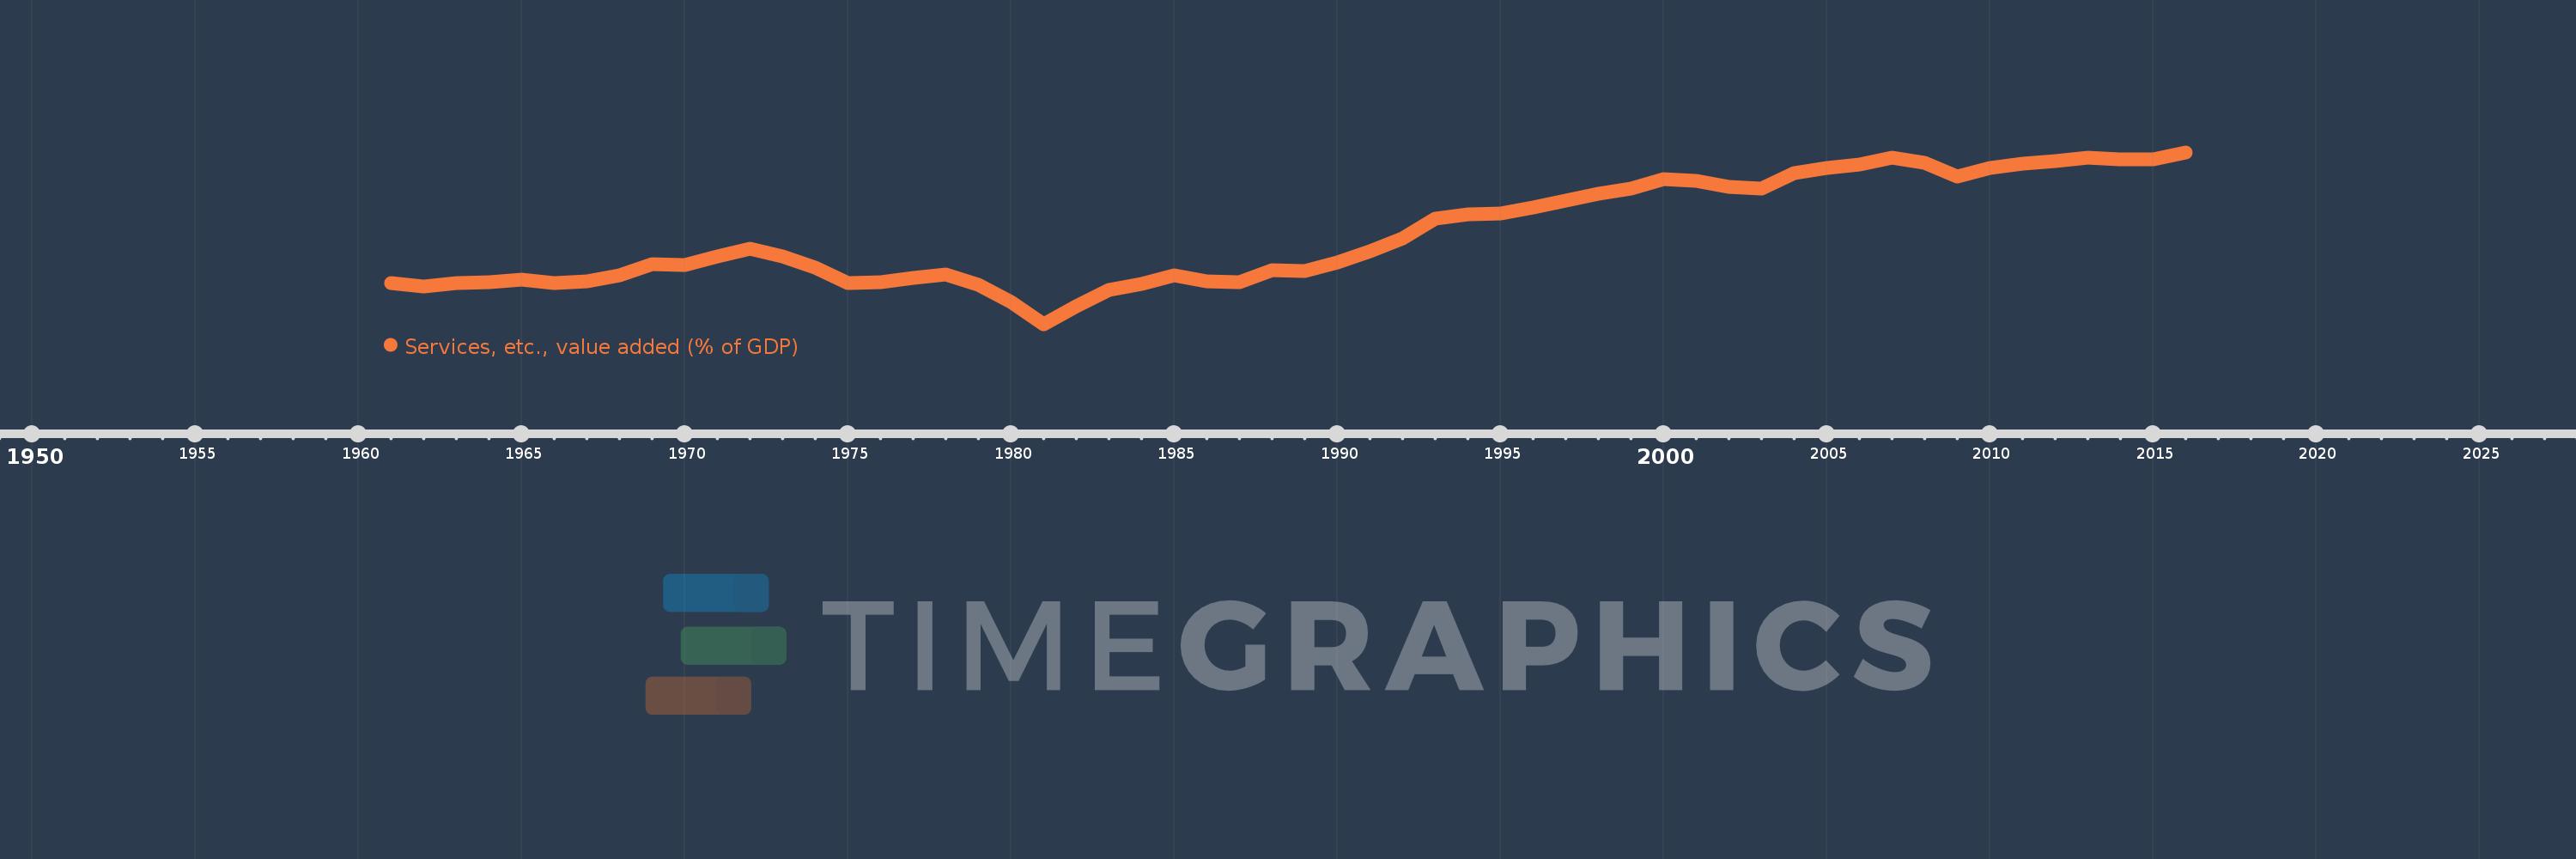
Services, etc., value added (% of GDP)
2016,2015,2014,2013,2012,2011,2010,2009,2008,2007,2006,2005,2004,2003,2002,2001,2000,1999,1998,1997,1996,1995,1994,1993,1992,1991,1990,1989,1988,1987,1986,1985,1984,1983,1982,1981,1980,1979,1978,1977,1976,1975,1974,1973,1972,1971,1970,1969,1968,1967,1966,1965,1964,1963,1962,1961
Queste statistiche in altri paesi:
AfghanistanAlbaniaAlgeriaAndorraAngolaAntigua and BarbudaArab WorldArgentinaArmeniaArubaAustraliaAustriaAzerbaijanBahamas, TheBahrainBangladeshBarbadosBelarusBelgiumBelizeBeninBermudaBhutanBoliviaBosnia and HerzegovinaBotswanaBrazilBrunei DarussalamBulgariaBurkina FasoBurundiCabo VerdeCambodiaCameroonCanadaCaribbean small statesCentral African RepublicCentral Europe and the BalticsChadChileChinaColombiaComorosCongo, Dem. Rep.Congo, Rep.Costa RicaCote d'IvoireCroatiaCubaCyprusCzech RepublicDenmarkDjiboutiDominicaDominican RepublicEarly-demographic dividendEast Asia & PacificEast Asia & Pacific (excluding high income)East Asia & Pacific (IDA & IBRD countries)EcuadorEgypt, Arab Rep.El SalvadorEquatorial GuineaEritreaEstoniaEthiopiaEuro areaEurope & Central AsiaEurope & Central Asia (excluding high income)Europe & Central Asia (IDA & IBRD countries)European UnionFaroe IslandsFijiFinlandFragile and conflict affected situationsFranceGabonGambia, TheGeorgiaGermanyGhanaGreeceGrenadaGuatemalaGuineaGuinea-BissauGuyanaHeavily indebted poor countries (HIPC)High incomeHondurasHong Kong SAR, ChinaHungaryIBRD onlyIcelandIDA & IBRD totalIDA blendIDA onlyIDA totalIndiaIndonesiaIran, Islamic Rep.IrelandItalyJamaicaJapanJordanKazakhstanKenyaKiribatiKorea, Rep.KosovoKuwaitKyrgyz RepublicLao PDRLate-demographic dividendLatin America & Caribbean Latin America & Caribbean (excluding high income)Latin America & the Caribbean (IDA & IBRD countries)LatviaLeast developed countries: UN classificationLebanonLesothoLibyaLithuaniaLow & middle incomeLow incomeLower middle incomeLuxembourgMacao SAR, ChinaMacedonia, FYRMadagascarMalawiMalaysiaMaldivesMaliMaltaMarshall IslandsMauritaniaMauritiusMexicoMicronesia, Fed. Sts.Middle East & North AfricaMiddle East & North Africa (excluding high income)Middle East & North Africa (IDA & IBRD countries)Middle incomeMoldovaMongoliaMontenegroMoroccoMozambiqueMyanmarNamibiaNepalNetherlandsNew CaledoniaNew ZealandNicaraguaNigerNigeriaNorth AmericaNorwayOECD membersOmanOther small statesPacific island small statesPakistanPalauPanamaPapua New GuineaParaguayPeruPhilippinesPolandPortugalPost-demographic dividendPre-demographic dividendPuerto RicoQatarRomaniaRussian FederationRwandaSao Tome and PrincipeSaudi ArabiaSenegalSerbiaSeychellesSierra LeoneSingaporeSlovak RepublicSloveniaSmall statesSolomon IslandsSomaliaSouth AfricaSouth AsiaSouth Asia (IDA & IBRD)SpainSri LankaSt. Kitts and NevisSt. LuciaSt. Vincent and the GrenadinesSub-Saharan Africa Sub-Saharan Africa (excluding high income)Sub-Saharan Africa (IDA & IBRD countries)SudanSurinameSwazilandSwedenSwitzerlandSyrian Arab RepublicTajikistanTanzaniaThailandTimor-LesteTogoTongaTrinidad and TobagoTunisiaTurkeyTurkmenistanTuvaluUgandaUkraineUnited KingdomUnited StatesUpper middle incomeUruguayUzbekistanVanuatuVenezuela, RBVietnamWest Bank and GazaWorldYemen, Rep.ZambiaZimbabwe Linea del tempo:
Questa scala temporale mostra un grafico dal 1961 anno al 2016 anno. South Africa. I dati fino ad 1960 anno non disponibili. Il numero di osservazioni attuali secondo i date: 56.
La fonte (nome):
Indicatori dello sviluppo mondiale
La fonte (organizzazione):
World Bank national accounts data, and OECD National Accounts data files.
Categorie:
Economy & Growth
sono stati aggiornati
23 apr 2017 anni
Indicatori delle variazioni dei valori per anni
Minima:
45.428
1 gen 1981 anni
Massimo:
68.73
1 gen 2016 anni
Alla data di osservazione
Valore
Variazione assoluta
La variazione rispetto al valore precedente
1 gen 1961 anni
50.972
+50.972
0.0%
1 gen 1962 anni
50.503
-0.469
-0.92%
1 gen 1963 anni
51.005
+0.502
0.99%
1 gen 1964 anni
51.118
+0.112
0.22%
1 gen 1965 anni
51.428
+0.311
0.61%
1 gen 1966 anni
50.976
-0.452
-0.88%
1 gen 1967 anni
51.226
+0.25
0.49%
1 gen 1968 anni
52.029
+0.803
1.57%
1 gen 1969 anni
53.55
+1.521
2.92%
1 gen 1970 anni
53.482
-0.068
-0.13%
1 gen 1971 anni
54.655
+1.174
2.19%
1 gen 1972 anni
55.711
+1.056
1.93%
1 gen 1973 anni
54.644
-1.068
-1.92%
1 gen 1974 anni
53.087
-1.556
-2.85%
1 gen 1975 anni
50.956
-2.131
-4.01%
1 gen 1976 anni
51.162
+0.205
0.4%
1 gen 1977 anni
51.689
+0.528
1.03%
1 gen 1978 anni
52.206
+0.517
1.0%
1 gen 1979 anni
50.792
-1.414
-2.71%
1 gen 1980 anni
48.396
-2.397
-4.72%
1 gen 1981 anni
45.428
-2.967
-6.13%
1 gen 1982 anni
47.889
+2.46
5.42%
1 gen 1983 anni
50.056
+2.167
4.53%
1 gen 1984 anni
50.854
+0.798
1.59%
1 gen 1985 anni
52.009
+1.155
2.27%
1 gen 1986 anni
51.193
-0.816
-1.57%
1 gen 1987 anni
51.077
-0.116
-0.23%
1 gen 1988 anni
52.744
+1.667
3.26%
1 gen 1989 anni
52.615
-0.13
-0.25%
1 gen 1990 anni
53.86
+1.245
2.37%
1 gen 1991 anni
55.273
+1.413
2.62%
1 gen 1992 anni
57.084
+1.811
3.28%
1 gen 1993 anni
59.776
+2.692
4.72%
1 gen 1994 anni
60.286
+0.51
0.85%
1 gen 1995 anni
60.391
+0.105
0.17%
1 gen 1996 anni
61.266
+0.875
1.45%
1 gen 1997 anni
62.204
+0.939
1.53%
1 gen 1998 anni
63.092
+0.888
1.43%
1 gen 1999 anni
63.859
+0.767
1.22%
1 gen 2000 anni
65.089
+1.229
1.92%
1 gen 2001 anni
64.819
-0.269
-0.41%
1 gen 2002 anni
64.082
-0.738
-1.14%
1 gen 2003 anni
63.787
-0.294
-0.46%
1 gen 2004 anni
65.923
+2.135
3.35%
1 gen 2005 anni
66.656
+0.733
1.11%
1 gen 2006 anni
67.056
+0.4
0.6%
1 gen 2007 anni
68.003
+0.947
1.41%
1 gen 2008 anni
67.351
-0.651
-0.96%
1 gen 2009 anni
65.477
-1.874
-2.78%
1 gen 2010 anni
66.636
+1.158
1.77%
1 gen 2011 anni
67.211
+0.575
0.86%
1 gen 2012 anni
67.561
+0.35
0.52%
1 gen 2013 anni
67.992
+0.431
0.64%
1 gen 2014 anni
67.835
-0.157
-0.23%
1 gen 2015 anni
67.841
+0.006
0.01%
1 gen 2016 anni
68.73
+0.889
1.31%
Classificazione dei paesi secondo i statistiche attuali per anni


Commenti: