29
/it/
it
AIzaSyAYiBZKx7MnpbEhh9jyipgxe19OcubqV5w
April 1, 2024
37003
IBRD only
IBD
false
2
1
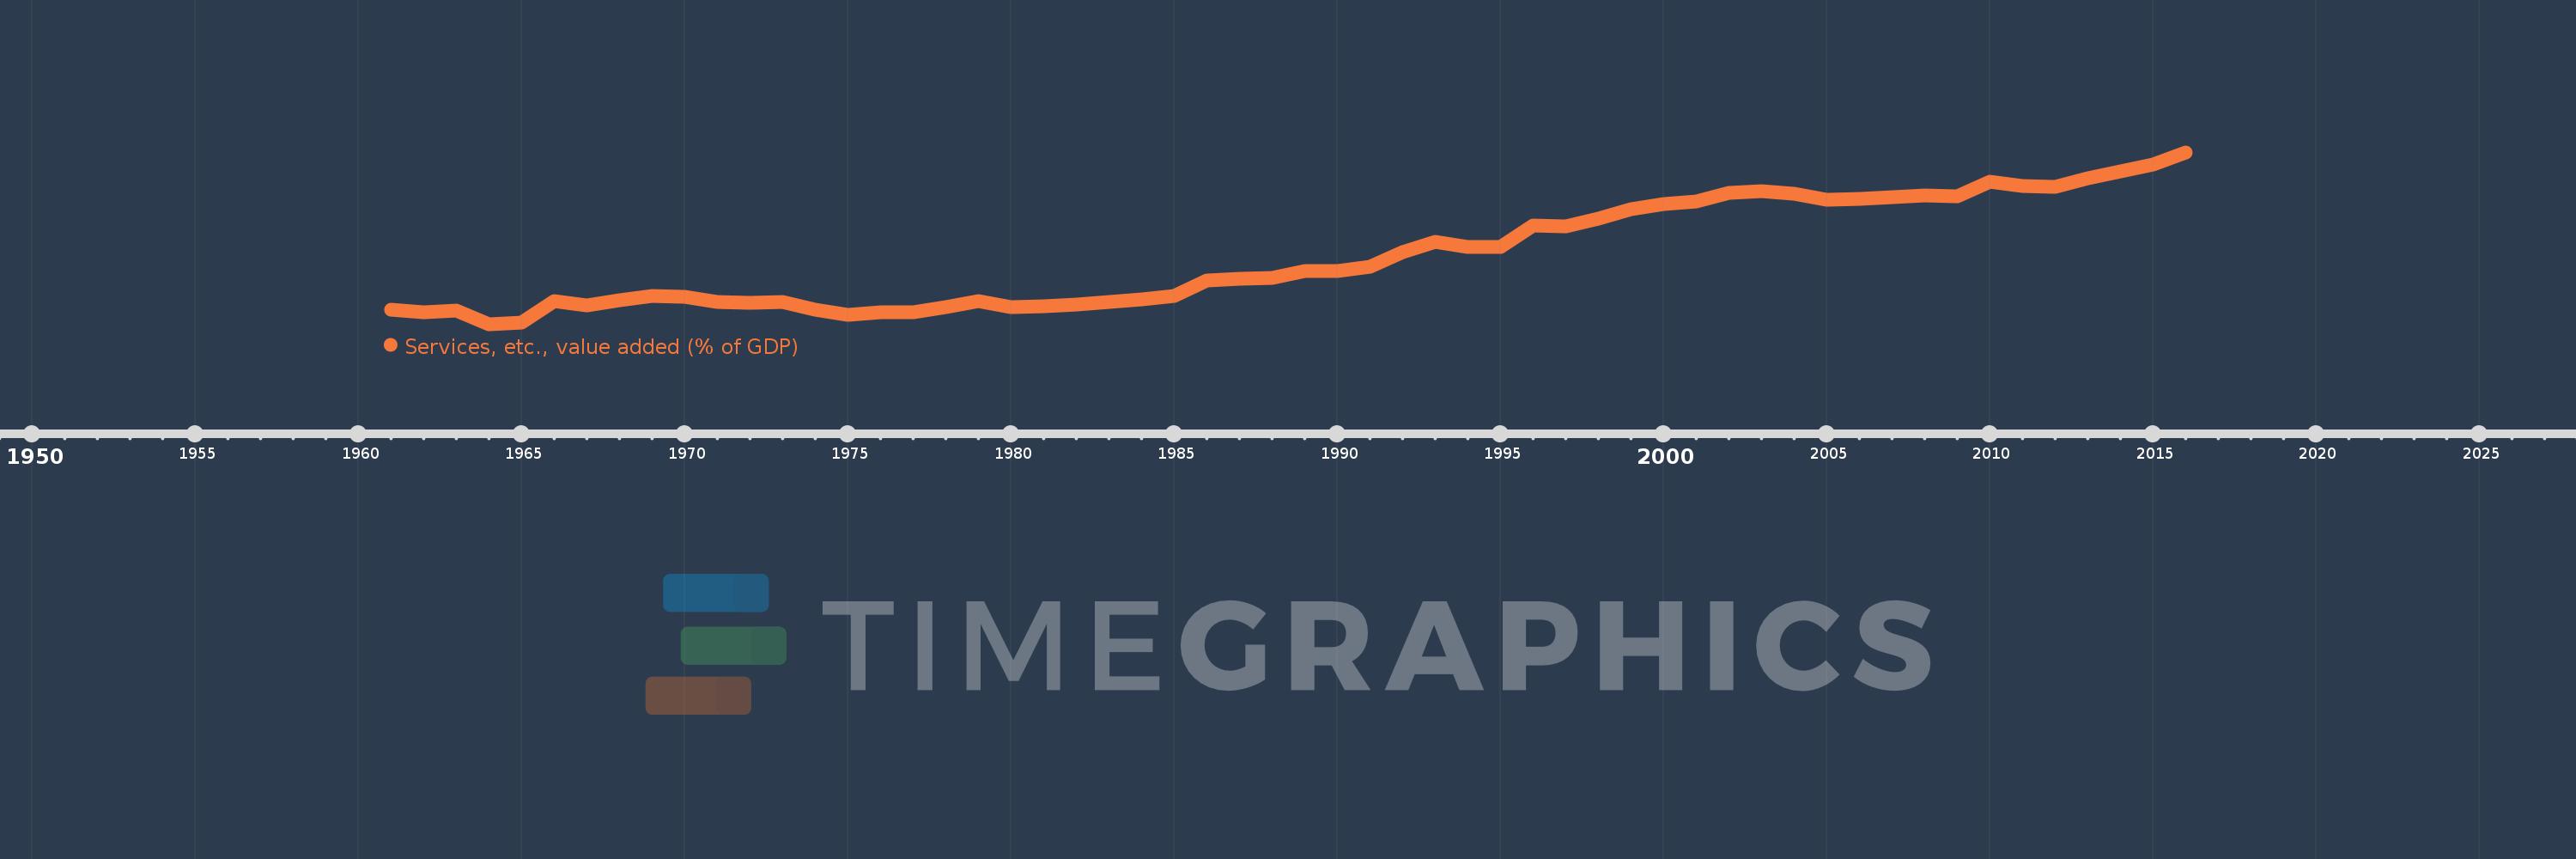
Services, etc., value added (% of GDP)
2016,2015,2014,2013,2012,2011,2010,2009,2008,2007,2006,2005,2004,2003,2002,2001,2000,1999,1998,1997,1996,1995,1994,1993,1992,1991,1990,1989,1988,1987,1986,1985,1984,1983,1982,1981,1980,1979,1978,1977,1976,1975,1974,1973,1972,1971,1970,1969,1968,1967,1966,1965,1964,1963,1962,1961
Queste statistiche in altri paesi:
AfghanistanAlbaniaAlgeriaAndorraAngolaAntigua and BarbudaArab WorldArgentinaArmeniaArubaAustraliaAustriaAzerbaijanBahamas, TheBahrainBangladeshBarbadosBelarusBelgiumBelizeBeninBermudaBhutanBoliviaBosnia and HerzegovinaBotswanaBrazilBrunei DarussalamBulgariaBurkina FasoBurundiCabo VerdeCambodiaCameroonCanadaCaribbean small statesCentral African RepublicCentral Europe and the BalticsChadChileChinaColombiaComorosCongo, Dem. Rep.Congo, Rep.Costa RicaCote d'IvoireCroatiaCubaCyprusCzech RepublicDenmarkDjiboutiDominicaDominican RepublicEarly-demographic dividendEast Asia & PacificEast Asia & Pacific (excluding high income)East Asia & Pacific (IDA & IBRD countries)EcuadorEgypt, Arab Rep.El SalvadorEquatorial GuineaEritreaEstoniaEthiopiaEuro areaEurope & Central AsiaEurope & Central Asia (excluding high income)Europe & Central Asia (IDA & IBRD countries)European UnionFaroe IslandsFijiFinlandFragile and conflict affected situationsFranceGabonGambia, TheGeorgiaGermanyGhanaGreeceGrenadaGuatemalaGuineaGuinea-BissauGuyanaHeavily indebted poor countries (HIPC)High incomeHondurasHong Kong SAR, ChinaHungaryIBRD onlyIcelandIDA & IBRD totalIDA blendIDA onlyIDA totalIndiaIndonesiaIran, Islamic Rep.IrelandItalyJamaicaJapanJordanKazakhstanKenyaKiribatiKorea, Rep.KosovoKuwaitKyrgyz RepublicLao PDRLate-demographic dividendLatin America & Caribbean Latin America & Caribbean (excluding high income)Latin America & the Caribbean (IDA & IBRD countries)LatviaLeast developed countries: UN classificationLebanonLesothoLibyaLithuaniaLow & middle incomeLow incomeLower middle incomeLuxembourgMacao SAR, ChinaMacedonia, FYRMadagascarMalawiMalaysiaMaldivesMaliMaltaMarshall IslandsMauritaniaMauritiusMexicoMicronesia, Fed. Sts.Middle East & North AfricaMiddle East & North Africa (excluding high income)Middle East & North Africa (IDA & IBRD countries)Middle incomeMoldovaMongoliaMontenegroMoroccoMozambiqueMyanmarNamibiaNepalNetherlandsNew CaledoniaNew ZealandNicaraguaNigerNigeriaNorth AmericaNorwayOECD membersOmanOther small statesPacific island small statesPakistanPalauPanamaPapua New GuineaParaguayPeruPhilippinesPolandPortugalPost-demographic dividendPre-demographic dividendPuerto RicoQatarRomaniaRussian FederationRwandaSao Tome and PrincipeSaudi ArabiaSenegalSerbiaSeychellesSierra LeoneSingaporeSlovak RepublicSloveniaSmall statesSolomon IslandsSomaliaSouth AfricaSouth AsiaSouth Asia (IDA & IBRD)SpainSri LankaSt. Kitts and NevisSt. LuciaSt. Vincent and the GrenadinesSub-Saharan Africa Sub-Saharan Africa (excluding high income)Sub-Saharan Africa (IDA & IBRD countries)SudanSurinameSwazilandSwedenSwitzerlandSyrian Arab RepublicTajikistanTanzaniaThailandTimor-LesteTogoTongaTrinidad and TobagoTunisiaTurkeyTurkmenistanTuvaluUgandaUkraineUnited KingdomUnited StatesUpper middle incomeUruguayUzbekistanVanuatuVenezuela, RBVietnamWest Bank and GazaWorldYemen, Rep.ZambiaZimbabwe Linea del tempo:
Questa scala temporale mostra un grafico dal 1961 anno al 2016 anno. IBRD only. I dati fino ad 1960 anno non disponibili. Il numero di osservazioni attuali secondo i date: 56.
La fonte (nome):
Indicatori dello sviluppo mondiale
La fonte (organizzazione):
World Bank national accounts data, and OECD National Accounts data files.
Categorie:
Economy & Growth
sono stati aggiornati
23 apr 2017 anni
Indicatori delle variazioni dei valori per anni
Minima:
34.754
1 gen 1964 anni
Massimo:
57.706
1 gen 2016 anni
Alla data di osservazione
Valore
Variazione assoluta
La variazione rispetto al valore precedente
1 gen 1961 anni
36.715
+36.715
0.0%
1 gen 1962 anni
36.371
-0.344
-0.94%
1 gen 1963 anni
36.578
+0.207
0.57%
1 gen 1964 anni
34.754
-1.824
-4.99%
1 gen 1965 anni
34.942
+0.188
0.54%
1 gen 1966 anni
37.786
+2.844
8.14%
1 gen 1967 anni
37.258
-0.528
-1.4%
1 gen 1968 anni
37.913
+0.655
1.76%
1 gen 1969 anni
38.577
+0.663
1.75%
1 gen 1970 anni
38.419
-0.158
-0.41%
1 gen 1971 anni
37.692
-0.727
-1.89%
1 gen 1972 anni
37.616
-0.076
-0.2%
1 gen 1973 anni
37.751
+0.135
0.36%
1 gen 1974 anni
36.715
-1.037
-2.75%
1 gen 1975 anni
35.998
-0.716
-1.95%
1 gen 1976 anni
36.354
+0.355
0.99%
1 gen 1977 anni
36.314
-0.04
-0.11%
1 gen 1978 anni
37.086
+0.772
2.13%
1 gen 1979 anni
37.866
+0.781
2.1%
1 gen 1980 anni
37.087
-0.78
-2.06%
1 gen 1981 anni
37.124
+0.037
0.1%
1 gen 1982 anni
37.412
+0.288
0.78%
1 gen 1983 anni
37.686
+0.273
0.73%
1 gen 1984 anni
38.078
+0.392
1.04%
1 gen 1985 anni
38.562
+0.485
1.27%
1 gen 1986 anni
40.588
+2.025
5.25%
1 gen 1987 anni
40.878
+0.29
0.71%
1 gen 1988 anni
40.925
+0.047
0.11%
1 gen 1989 anni
41.841
+0.916
2.24%
1 gen 1990 anni
41.884
+0.043
0.1%
1 gen 1991 anni
42.465
+0.581
1.39%
1 gen 1992 anni
44.328
+1.863
4.39%
1 gen 1993 anni
45.723
+1.395
3.15%
1 gen 1994 anni
45.099
-0.624
-1.36%
1 gen 1995 anni
45.127
+0.027
0.06%
1 gen 1996 anni
47.953
+2.826
6.26%
1 gen 1997 anni
47.851
-0.102
-0.21%
1 gen 1998 anni
48.889
+1.038
2.17%
1 gen 1999 anni
50.086
+1.197
2.45%
1 gen 2000 anni
50.762
+0.676
1.35%
1 gen 2001 anni
51.101
+0.339
0.67%
1 gen 2002 anni
52.292
+1.191
2.33%
1 gen 2003 anni
52.583
+0.291
0.56%
1 gen 2004 anni
52.241
-0.342
-0.65%
1 gen 2005 anni
51.417
-0.824
-1.58%
1 gen 2006 anni
51.527
+0.11
0.21%
1 gen 2007 anni
51.766
+0.239
0.46%
1 gen 2008 anni
51.912
+0.145
0.28%
1 gen 2009 anni
51.886
-0.026
-0.05%
1 gen 2010 anni
53.785
+1.899
3.66%
1 gen 2011 anni
53.266
-0.519
-0.97%
1 gen 2012 anni
53.132
-0.134
-0.25%
1 gen 2013 anni
54.275
+1.143
2.15%
1 gen 2014 anni
55.223
+0.948
1.75%
1 gen 2015 anni
56.131
+0.908
1.65%
1 gen 2016 anni
57.706
+1.575
2.81%
Classificazione dei paesi secondo i statistiche attuali per anni


Commenti: