29
/it/
it
AIzaSyAYiBZKx7MnpbEhh9jyipgxe19OcubqV5w
April 1, 2024
30622
Europe & Central Asia
ECS
false
2
1
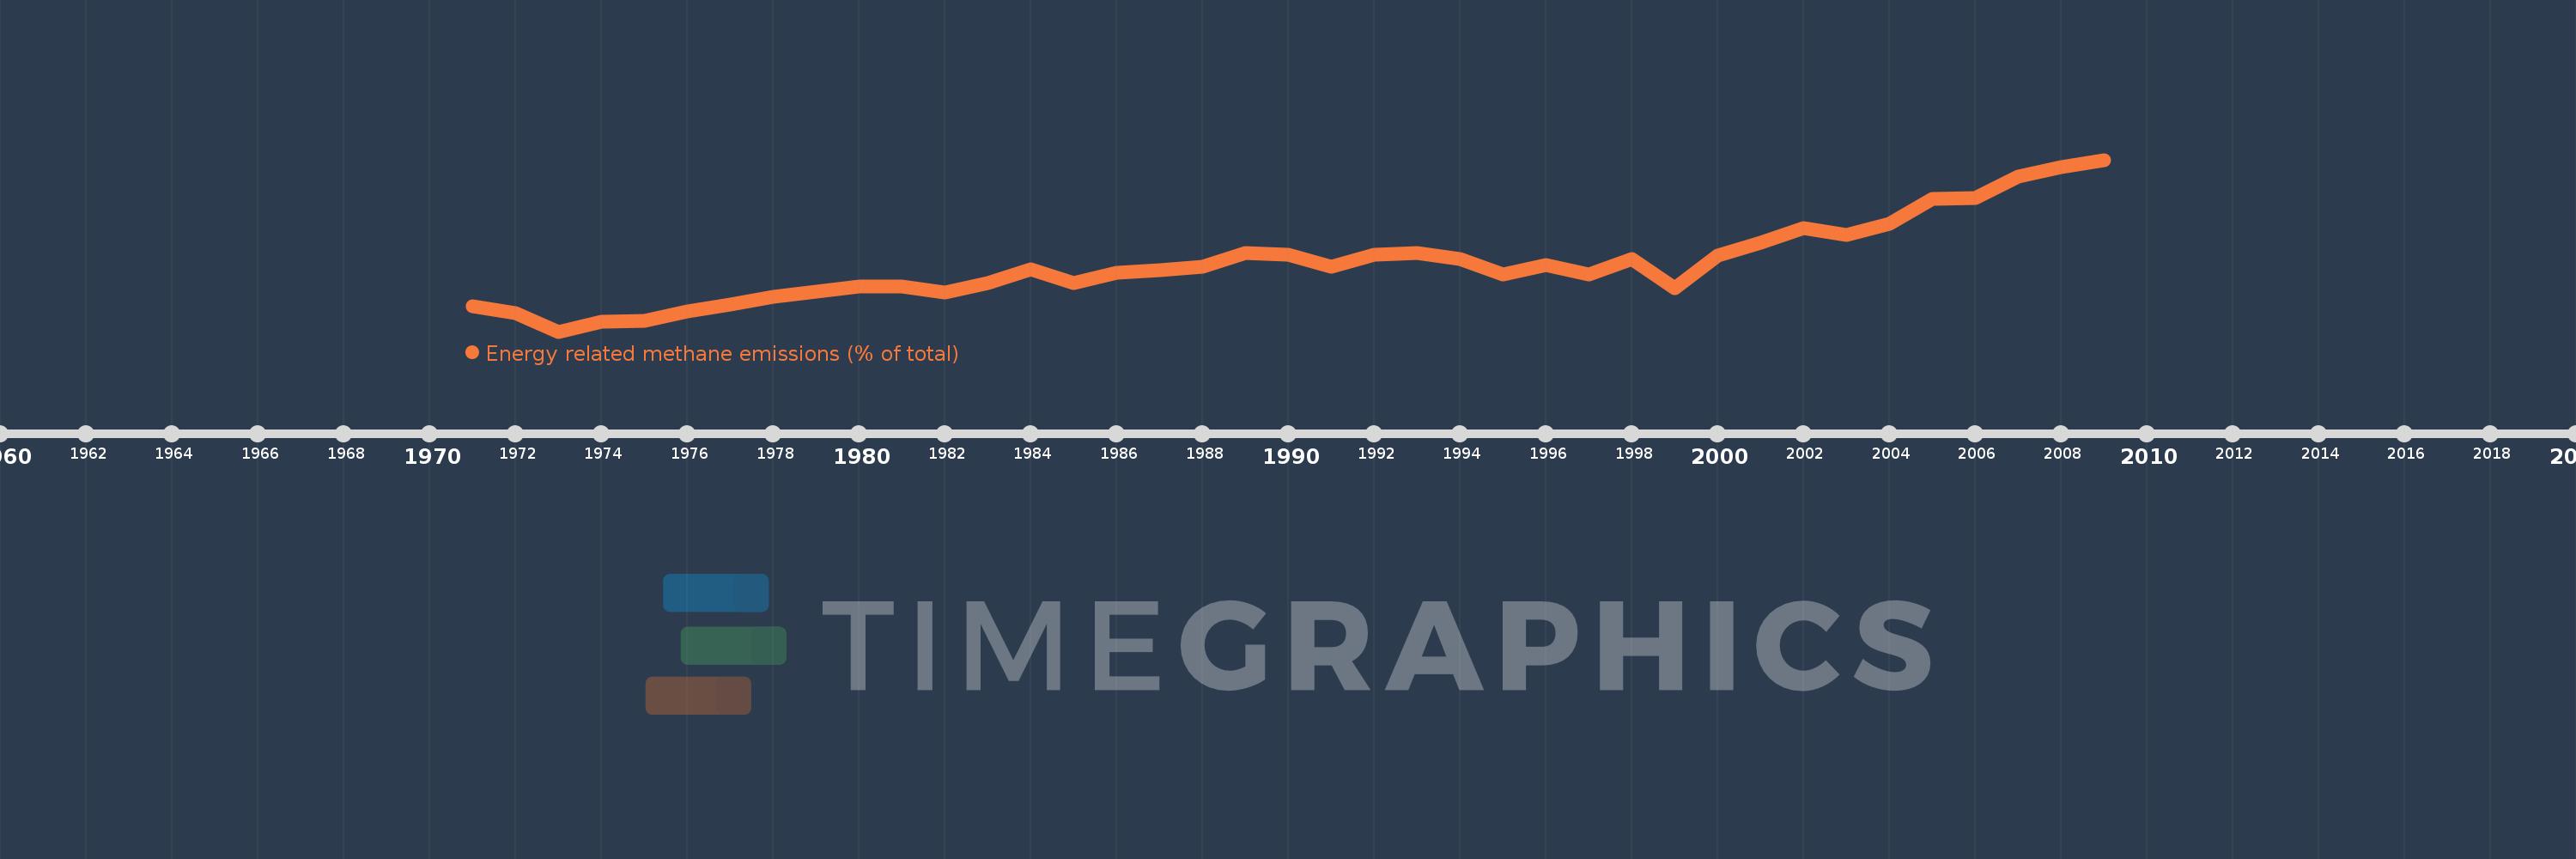
Energy related methane emissions (% of total)
2009,2008,2007,2006,2005,2004,2003,2002,2001,2000,1999,1998,1997,1996,1995,1994,1993,1992,1991,1990,1989,1988,1987,1986,1985,1984,1983,1982,1981,1980,1979,1978,1977,1976,1975,1974,1973,1972,1971
Queste statistiche in altri paesi:
AfghanistanAlbaniaAlgeriaAmerican SamoaAngolaAntigua and BarbudaArab WorldArgentinaArmeniaArubaAustraliaAustriaAzerbaijanBahamas, TheBahrainBangladeshBarbadosBelarusBelgiumBelizeBeninBermudaBhutanBoliviaBosnia and HerzegovinaBotswanaBrazilBritish Virgin IslandsBrunei DarussalamBulgariaBurkina FasoBurundiCabo VerdeCambodiaCameroonCanadaCaribbean small statesCayman IslandsCentral African RepublicCentral Europe and the BalticsChadChileChinaColombiaComorosCongo, Dem. Rep.Congo, Rep.Costa RicaCote d'IvoireCroatiaCubaCyprusCzech RepublicDenmarkDjiboutiDominicaDominican RepublicEarly-demographic dividendEast Asia & PacificEast Asia & Pacific (excluding high income)East Asia & Pacific (IDA & IBRD countries)EcuadorEgypt, Arab Rep.El SalvadorEquatorial GuineaEritreaEstoniaEthiopiaEuro areaEurope & Central AsiaEurope & Central Asia (excluding high income)Europe & Central Asia (IDA & IBRD countries)European UnionFaroe IslandsFijiFinlandFragile and conflict affected situationsFranceFrench PolynesiaGabonGambia, TheGeorgiaGermanyGhanaGibraltarGreeceGreenlandGrenadaGuamGuatemalaGuineaGuinea-BissauGuyanaHaitiHeavily indebted poor countries (HIPC)High incomeHondurasHong Kong SAR, ChinaHungaryIBRD onlyIcelandIDA & IBRD totalIDA blendIDA onlyIDA totalIndiaIndonesiaIran, Islamic Rep.IraqIrelandIsraelItalyJamaicaJapanJordanKazakhstanKenyaKiribatiKorea, Dem. People’s Rep.Korea, Rep.KuwaitKyrgyz RepublicLao PDRLate-demographic dividendLatin America & Caribbean Latin America & Caribbean (excluding high income)Latin America & the Caribbean (IDA & IBRD countries)LatviaLeast developed countries: UN classificationLebanonLesothoLiberiaLibyaLithuaniaLow & middle incomeLow incomeLower middle incomeLuxembourgMacao SAR, ChinaMacedonia, FYRMadagascarMalawiMalaysiaMaldivesMaliMaltaMarshall IslandsMauritaniaMauritiusMexicoMicronesia, Fed. Sts.Middle East & North AfricaMiddle East & North Africa (excluding high income)Middle East & North Africa (IDA & IBRD countries)Middle incomeMoldovaMongoliaMoroccoMozambiqueMyanmarNamibiaNauruNepalNetherlandsNew CaledoniaNew ZealandNicaraguaNigerNigeriaNorth AmericaNorthern Mariana IslandsNorwayOECD membersOmanOther small statesPacific island small statesPakistanPalauPanamaPapua New GuineaParaguayPeruPhilippinesPolandPortugalPost-demographic dividendPre-demographic dividendPuerto RicoQatarRomaniaRussian FederationRwandaSamoaSao Tome and PrincipeSaudi ArabiaSenegalSerbiaSeychellesSierra LeoneSingaporeSlovak RepublicSloveniaSmall statesSolomon IslandsSomaliaSouth AfricaSouth AsiaSouth Asia (IDA & IBRD)SpainSri LankaSt. Kitts and NevisSt. LuciaSt. Vincent and the GrenadinesSub-Saharan Africa Sub-Saharan Africa (excluding high income)Sub-Saharan Africa (IDA & IBRD countries)SudanSurinameSwazilandSwedenSwitzerlandSyrian Arab RepublicTajikistanTanzaniaThailandTimor-LesteTogoTongaTrinidad and TobagoTunisiaTurkeyTurkmenistanTurks and Caicos IslandsTuvaluUgandaUkraineUnited Arab EmiratesUnited KingdomUnited StatesUpper middle incomeUruguayUzbekistanVanuatuVenezuela, RBVietnamVirgin Islands (U.S.)WorldYemen, Rep.ZambiaZimbabwe Linea del tempo:
Questa scala temporale mostra un grafico dal 1971 anno al 2009 anno. Europe & Central Asia. I dati fino ad 1970 anno non disponibili. Il numero di osservazioni attuali secondo i date: 39.
La fonte (nome):
Indicatori dello sviluppo mondiale
La fonte (organizzazione):
World Bank staff estimates from original source: European Commission, Joint Research Centre (JRC)/Netherlands Environmental Assessment Agency (PBL). Emission Database for Global Atmospheric Research (EDGAR): http://edgar.jrc.ec.europa.eu/.
Categorie:
Energy & Mining, Environment
sono stati aggiornati
23 apr 2017 anni
Indicatori delle variazioni dei valori per anni
Minima:
43.307
1 gen 1973 anni
Massimo:
53.952
1 gen 2009 anni
Alla data di osservazione
Valore
Variazione assoluta
La variazione rispetto al valore precedente
1 gen 1971 anni
44.891
+44.891
0.0%
1 gen 1972 anni
44.471
-0.42
-0.94%
1 gen 1973 anni
43.307
-1.164
-2.62%
1 gen 1974 anni
43.908
+0.601
1.39%
1 gen 1975 anni
43.954
+0.046
0.1%
1 gen 1976 anni
44.542
+0.589
1.34%
1 gen 1977 anni
45.004
+0.461
1.04%
1 gen 1978 anni
45.448
+0.444
0.99%
1 gen 1979 anni
45.798
+0.35
0.77%
1 gen 1980 anni
46.114
+0.316
0.69%
1 gen 1981 anni
46.109
-0.005
-0.01%
1 gen 1982 anni
45.742
-0.367
-0.8%
1 gen 1983 anni
46.332
+0.59
1.29%
1 gen 1984 anni
47.147
+0.815
1.76%
1 gen 1985 anni
46.323
-0.824
-1.75%
1 gen 1986 anni
46.946
+0.623
1.34%
1 gen 1987 anni
47.122
+0.176
0.38%
1 gen 1988 anni
47.3
+0.178
0.38%
1 gen 1989 anni
48.161
+0.861
1.82%
1 gen 1990 anni
48.048
-0.113
-0.24%
1 gen 1991 anni
47.302
-0.746
-1.55%
1 gen 1992 anni
48.083
+0.781
1.65%
1 gen 1993 anni
48.181
+0.098
0.2%
1 gen 1994 anni
47.808
-0.374
-0.78%
1 gen 1995 anni
46.855
-0.953
-1.99%
1 gen 1996 anni
47.45
+0.595
1.27%
1 gen 1997 anni
46.853
-0.597
-1.26%
1 gen 1998 anni
47.785
+0.931
1.99%
1 gen 1999 anni
45.996
-1.788
-3.74%
1 gen 2000 anni
48.024
+2.028
4.41%
1 gen 2001 anni
48.809
+0.785
1.63%
1 gen 2002 anni
49.697
+0.888
1.82%
1 gen 2003 anni
49.289
-0.407
-0.82%
1 gen 2004 anni
49.989
+0.699
1.42%
1 gen 2005 anni
51.513
+1.524
3.05%
1 gen 2006 anni
51.579
+0.066
0.13%
1 gen 2007 anni
52.922
+1.343
2.6%
1 gen 2008 anni
53.48
+0.558
1.05%
1 gen 2009 anni
53.952
+0.472
0.88%
Classificazione dei paesi secondo i statistiche attuali per anni


Commenti: