29
/it/
it
AIzaSyAYiBZKx7MnpbEhh9jyipgxe19OcubqV5w
April 1, 2024
219498
Papua New Guinea
PNG
true
2
1
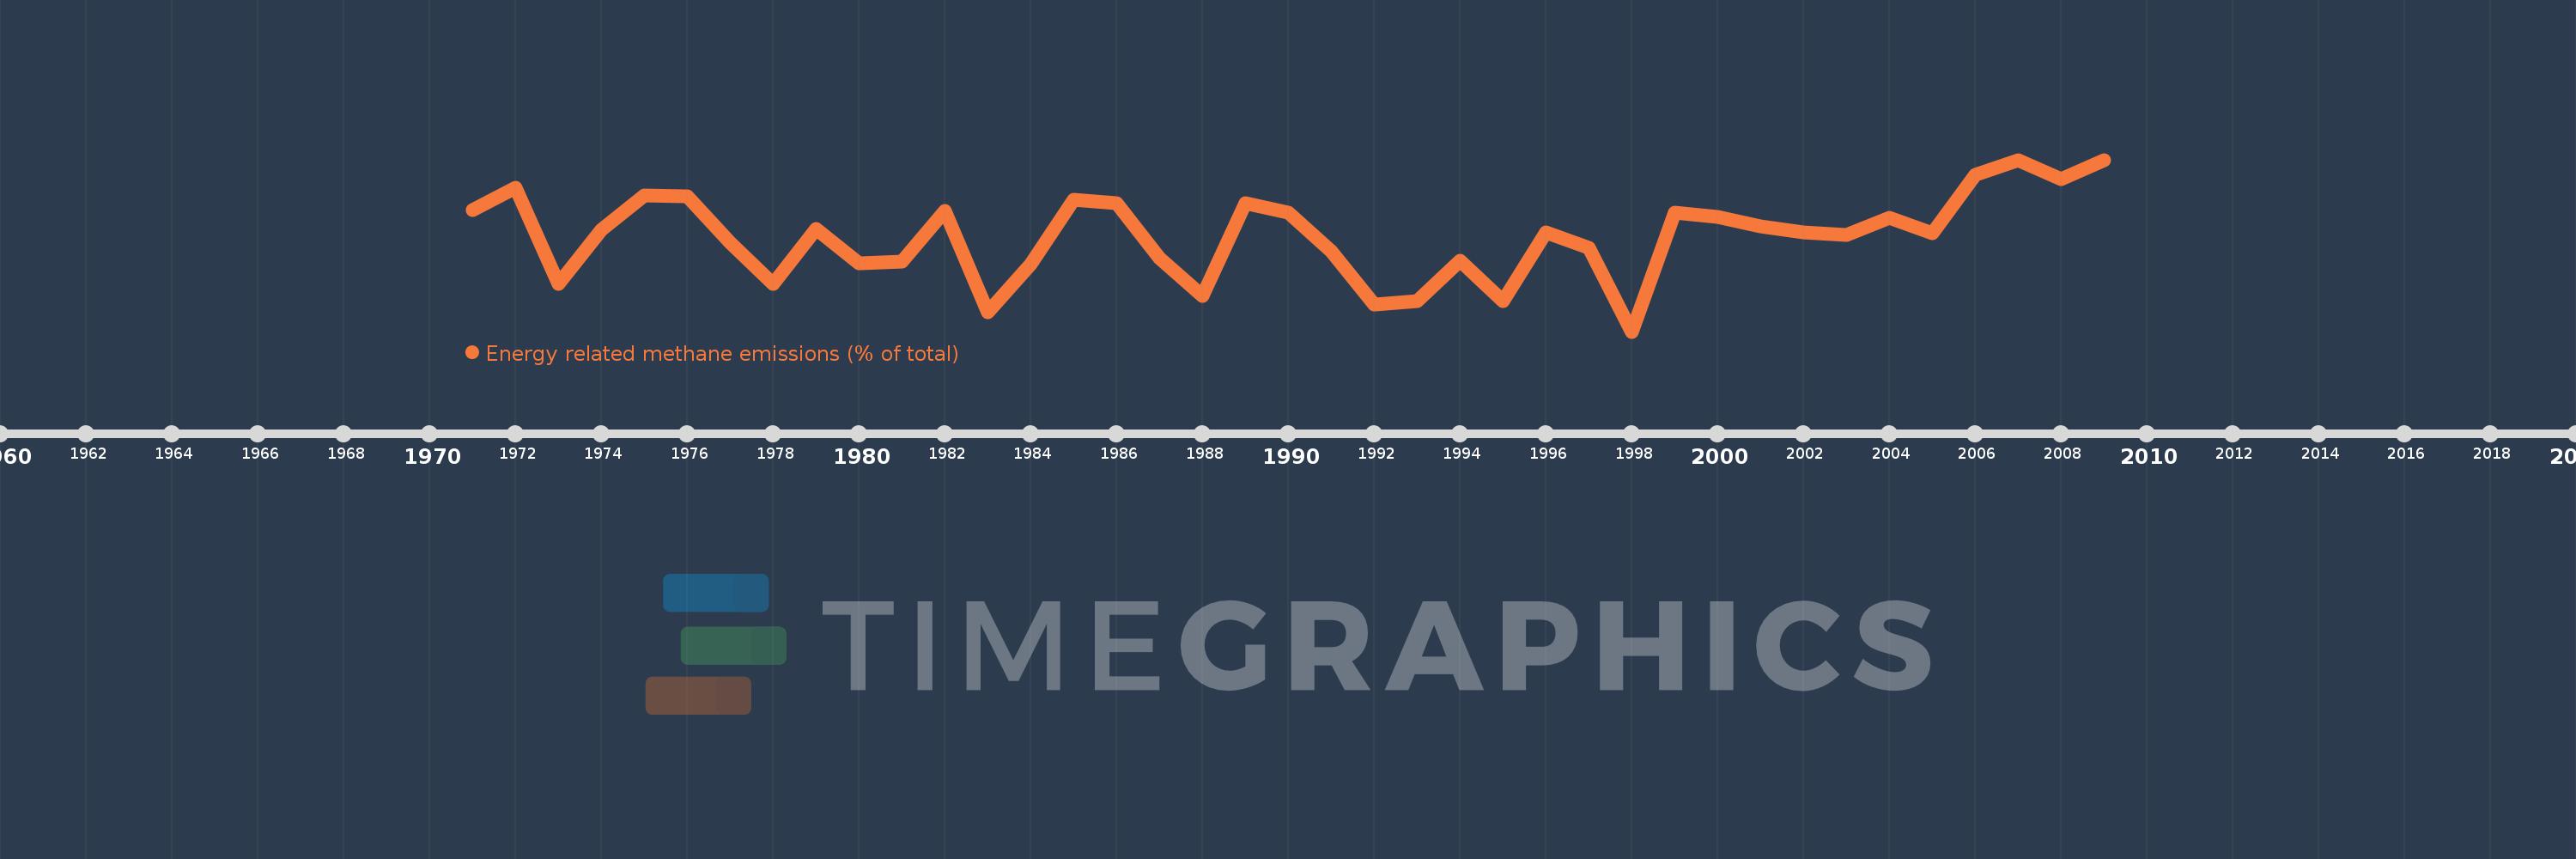
Energy related methane emissions (% of total)
2009,2008,2007,2006,2005,2004,2003,2002,2001,2000,1999,1998,1997,1996,1995,1994,1993,1992,1991,1990,1989,1988,1987,1986,1985,1984,1983,1982,1981,1980,1979,1978,1977,1976,1975,1974,1973,1972,1971
Queste statistiche in altri paesi:
AfghanistanAlbaniaAlgeriaAmerican SamoaAngolaAntigua and BarbudaArab WorldArgentinaArmeniaArubaAustraliaAustriaAzerbaijanBahamas, TheBahrainBangladeshBarbadosBelarusBelgiumBelizeBeninBermudaBhutanBoliviaBosnia and HerzegovinaBotswanaBrazilBritish Virgin IslandsBrunei DarussalamBulgariaBurkina FasoBurundiCabo VerdeCambodiaCameroonCanadaCaribbean small statesCayman IslandsCentral African RepublicCentral Europe and the BalticsChadChileChinaColombiaComorosCongo, Dem. Rep.Congo, Rep.Costa RicaCote d'IvoireCroatiaCubaCyprusCzech RepublicDenmarkDjiboutiDominicaDominican RepublicEarly-demographic dividendEast Asia & PacificEast Asia & Pacific (excluding high income)East Asia & Pacific (IDA & IBRD countries)EcuadorEgypt, Arab Rep.El SalvadorEquatorial GuineaEritreaEstoniaEthiopiaEuro areaEurope & Central AsiaEurope & Central Asia (excluding high income)Europe & Central Asia (IDA & IBRD countries)European UnionFaroe IslandsFijiFinlandFragile and conflict affected situationsFranceFrench PolynesiaGabonGambia, TheGeorgiaGermanyGhanaGibraltarGreeceGreenlandGrenadaGuamGuatemalaGuineaGuinea-BissauGuyanaHaitiHeavily indebted poor countries (HIPC)High incomeHondurasHong Kong SAR, ChinaHungaryIBRD onlyIcelandIDA & IBRD totalIDA blendIDA onlyIDA totalIndiaIndonesiaIran, Islamic Rep.IraqIrelandIsraelItalyJamaicaJapanJordanKazakhstanKenyaKiribatiKorea, Dem. People’s Rep.Korea, Rep.KuwaitKyrgyz RepublicLao PDRLate-demographic dividendLatin America & Caribbean Latin America & Caribbean (excluding high income)Latin America & the Caribbean (IDA & IBRD countries)LatviaLeast developed countries: UN classificationLebanonLesothoLiberiaLibyaLithuaniaLow & middle incomeLow incomeLower middle incomeLuxembourgMacao SAR, ChinaMacedonia, FYRMadagascarMalawiMalaysiaMaldivesMaliMaltaMarshall IslandsMauritaniaMauritiusMexicoMicronesia, Fed. Sts.Middle East & North AfricaMiddle East & North Africa (excluding high income)Middle East & North Africa (IDA & IBRD countries)Middle incomeMoldovaMongoliaMoroccoMozambiqueMyanmarNamibiaNauruNepalNetherlandsNew CaledoniaNew ZealandNicaraguaNigerNigeriaNorth AmericaNorthern Mariana IslandsNorwayOECD membersOmanOther small statesPacific island small statesPakistanPalauPanamaPapua New GuineaParaguayPeruPhilippinesPolandPortugalPost-demographic dividendPre-demographic dividendPuerto RicoQatarRomaniaRussian FederationRwandaSamoaSao Tome and PrincipeSaudi ArabiaSenegalSerbiaSeychellesSierra LeoneSingaporeSlovak RepublicSloveniaSmall statesSolomon IslandsSomaliaSouth AfricaSouth AsiaSouth Asia (IDA & IBRD)SpainSri LankaSt. Kitts and NevisSt. LuciaSt. Vincent and the GrenadinesSub-Saharan Africa Sub-Saharan Africa (excluding high income)Sub-Saharan Africa (IDA & IBRD countries)SudanSurinameSwazilandSwedenSwitzerlandSyrian Arab RepublicTajikistanTanzaniaThailandTimor-LesteTogoTongaTrinidad and TobagoTunisiaTurkeyTurkmenistanTurks and Caicos IslandsTuvaluUgandaUkraineUnited Arab EmiratesUnited KingdomUnited StatesUpper middle incomeUruguayUzbekistanVanuatuVenezuela, RBVietnamVirgin Islands (U.S.)WorldYemen, Rep.ZambiaZimbabwe Linea del tempo:
Questa scala temporale mostra un grafico dal 1971 anno al 2009 anno. Papua New Guinea. I dati fino ad 1970 anno non disponibili. Il numero di osservazioni attuali secondo i date: 39.
La fonte (nome):
Indicatori dello sviluppo mondiale
La fonte (organizzazione):
World Bank staff estimates from original source: European Commission, Joint Research Centre (JRC)/Netherlands Environmental Assessment Agency (PBL). Emission Database for Global Atmospheric Research (EDGAR): http://edgar.jrc.ec.europa.eu/.
Categorie:
Energy & Mining, Environment
sono stati aggiornati
23 apr 2017 anni
Indicatori delle variazioni dei valori per anni
Minima:
3.37
1 gen 1998 anni
Massimo:
45.768
1 gen 2007 anni
Alla data di osservazione
Valore
Variazione assoluta
La variazione rispetto al valore precedente
1 gen 1971 anni
33.41
+33.41
0.0%
1 gen 1972 anni
38.796
+5.385
16.12%
1 gen 1973 anni
15.213
-23.583
-60.79%
1 gen 1974 anni
28.467
+13.254
87.12%
1 gen 1975 anni
37.029
+8.562
30.08%
1 gen 1976 anni
36.761
-0.268
-0.72%
1 gen 1977 anni
25.39
-11.371
-30.93%
1 gen 1978 anni
15.056
-10.334
-40.7%
1 gen 1979 anni
28.71
+13.654
90.69%
1 gen 1980 anni
20.226
-8.484
-29.55%
1 gen 1981 anni
20.595
+0.37
1.83%
1 gen 1982 anni
33.199
+12.604
61.2%
1 gen 1983 anni
8.222
-24.977
-75.23%
1 gen 1984 anni
20.002
+11.78
143.27%
1 gen 1985 anni
35.811
+15.809
79.03%
1 gen 1986 anni
35.067
-0.744
-2.08%
1 gen 1987 anni
21.481
-13.586
-38.74%
1 gen 1988 anni
12.165
-9.317
-43.37%
1 gen 1989 anni
35.081
+22.917
188.39%
1 gen 1990 anni
32.663
-2.418
-6.89%
1 gen 1991 anni
23.145
-9.518
-29.14%
1 gen 1992 anni
10.072
-13.074
-56.49%
1 gen 1993 anni
10.951
+0.88
8.74%
1 gen 1994 anni
20.818
+9.867
90.1%
1 gen 1995 anni
10.965
-9.853
-47.33%
1 gen 1996 anni
27.896
+16.931
154.4%
1 gen 1997 anni
24.098
-3.798
-13.62%
1 gen 1998 anni
3.37
-20.728
-86.01%
1 gen 1999 anni
32.707
+29.337
870.45%
1 gen 2000 anni
31.611
-1.096
-3.35%
1 gen 2001 anni
29.415
-2.196
-6.95%
1 gen 2002 anni
27.83
-1.585
-5.39%
1 gen 2003 anni
27.164
-0.666
-2.39%
1 gen 2004 anni
31.412
+4.248
15.64%
1 gen 2005 anni
27.717
-3.695
-11.76%
1 gen 2006 anni
41.993
+14.277
51.51%
1 gen 2007 anni
45.768
+3.775
8.99%
1 gen 2008 anni
40.982
-4.786
-10.46%
1 gen 2009 anni
45.62
+4.638
11.32%
Classificazione dei paesi secondo i statistiche attuali per anni


Commenti: