29
/it/
it
AIzaSyAYiBZKx7MnpbEhh9jyipgxe19OcubqV5w
April 1, 2024
150281
Honduras
HND
true
2
1
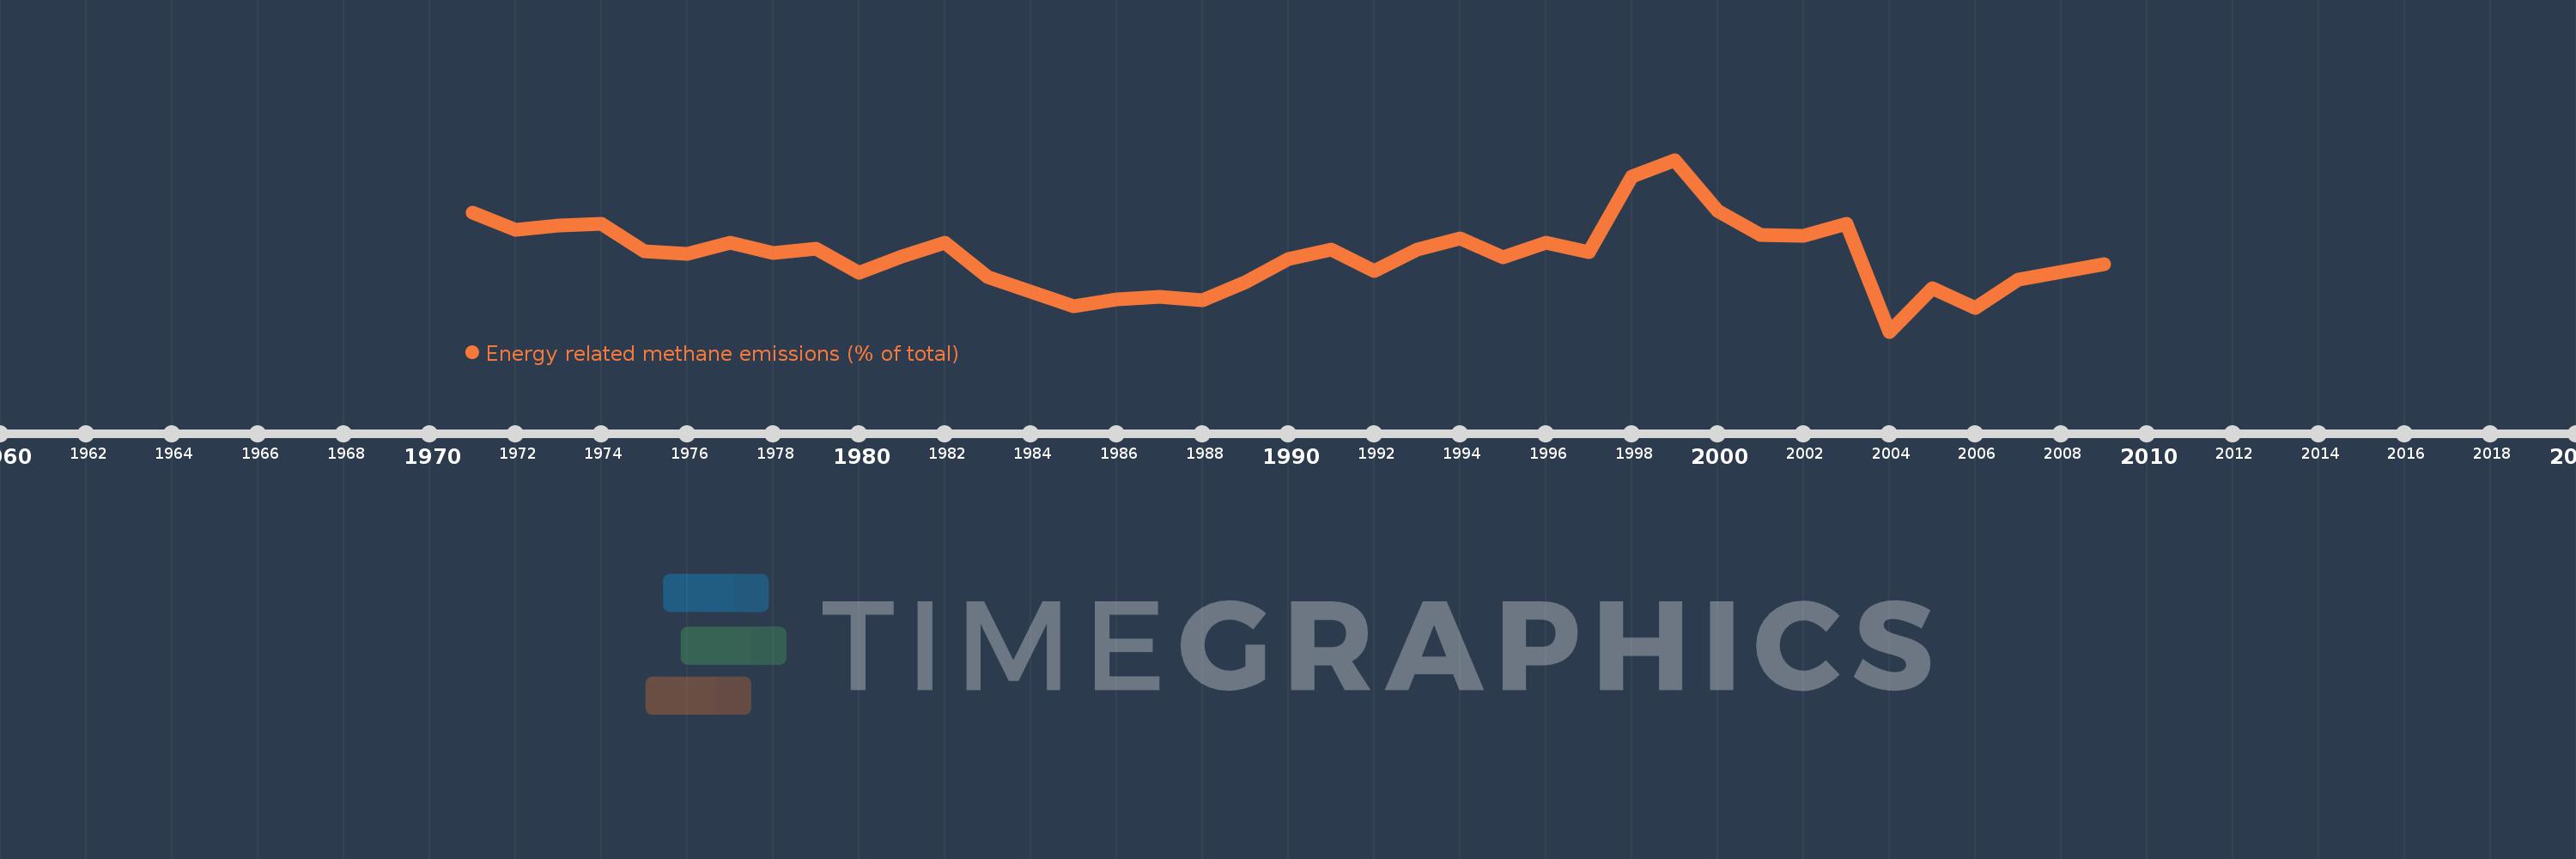
Energy related methane emissions (% of total)
2009,2008,2007,2006,2005,2004,2003,2002,2001,2000,1999,1998,1997,1996,1995,1994,1993,1992,1991,1990,1989,1988,1987,1986,1985,1984,1983,1982,1981,1980,1979,1978,1977,1976,1975,1974,1973,1972,1971
Queste statistiche in altri paesi:
AfghanistanAlbaniaAlgeriaAmerican SamoaAngolaAntigua and BarbudaArab WorldArgentinaArmeniaArubaAustraliaAustriaAzerbaijanBahamas, TheBahrainBangladeshBarbadosBelarusBelgiumBelizeBeninBermudaBhutanBoliviaBosnia and HerzegovinaBotswanaBrazilBritish Virgin IslandsBrunei DarussalamBulgariaBurkina FasoBurundiCabo VerdeCambodiaCameroonCanadaCaribbean small statesCayman IslandsCentral African RepublicCentral Europe and the BalticsChadChileChinaColombiaComorosCongo, Dem. Rep.Congo, Rep.Costa RicaCote d'IvoireCroatiaCubaCyprusCzech RepublicDenmarkDjiboutiDominicaDominican RepublicEarly-demographic dividendEast Asia & PacificEast Asia & Pacific (excluding high income)East Asia & Pacific (IDA & IBRD countries)EcuadorEgypt, Arab Rep.El SalvadorEquatorial GuineaEritreaEstoniaEthiopiaEuro areaEurope & Central AsiaEurope & Central Asia (excluding high income)Europe & Central Asia (IDA & IBRD countries)European UnionFaroe IslandsFijiFinlandFragile and conflict affected situationsFranceFrench PolynesiaGabonGambia, TheGeorgiaGermanyGhanaGibraltarGreeceGreenlandGrenadaGuamGuatemalaGuineaGuinea-BissauGuyanaHaitiHeavily indebted poor countries (HIPC)High incomeHondurasHong Kong SAR, ChinaHungaryIBRD onlyIcelandIDA & IBRD totalIDA blendIDA onlyIDA totalIndiaIndonesiaIran, Islamic Rep.IraqIrelandIsraelItalyJamaicaJapanJordanKazakhstanKenyaKiribatiKorea, Dem. People’s Rep.Korea, Rep.KuwaitKyrgyz RepublicLao PDRLate-demographic dividendLatin America & Caribbean Latin America & Caribbean (excluding high income)Latin America & the Caribbean (IDA & IBRD countries)LatviaLeast developed countries: UN classificationLebanonLesothoLiberiaLibyaLithuaniaLow & middle incomeLow incomeLower middle incomeLuxembourgMacao SAR, ChinaMacedonia, FYRMadagascarMalawiMalaysiaMaldivesMaliMaltaMarshall IslandsMauritaniaMauritiusMexicoMicronesia, Fed. Sts.Middle East & North AfricaMiddle East & North Africa (excluding high income)Middle East & North Africa (IDA & IBRD countries)Middle incomeMoldovaMongoliaMoroccoMozambiqueMyanmarNamibiaNauruNepalNetherlandsNew CaledoniaNew ZealandNicaraguaNigerNigeriaNorth AmericaNorthern Mariana IslandsNorwayOECD membersOmanOther small statesPacific island small statesPakistanPalauPanamaPapua New GuineaParaguayPeruPhilippinesPolandPortugalPost-demographic dividendPre-demographic dividendPuerto RicoQatarRomaniaRussian FederationRwandaSamoaSao Tome and PrincipeSaudi ArabiaSenegalSerbiaSeychellesSierra LeoneSingaporeSlovak RepublicSloveniaSmall statesSolomon IslandsSomaliaSouth AfricaSouth AsiaSouth Asia (IDA & IBRD)SpainSri LankaSt. Kitts and NevisSt. LuciaSt. Vincent and the GrenadinesSub-Saharan Africa Sub-Saharan Africa (excluding high income)Sub-Saharan Africa (IDA & IBRD countries)SudanSurinameSwazilandSwedenSwitzerlandSyrian Arab RepublicTajikistanTanzaniaThailandTimor-LesteTogoTongaTrinidad and TobagoTunisiaTurkeyTurkmenistanTurks and Caicos IslandsTuvaluUgandaUkraineUnited Arab EmiratesUnited KingdomUnited StatesUpper middle incomeUruguayUzbekistanVanuatuVenezuela, RBVietnamVirgin Islands (U.S.)WorldYemen, Rep.ZambiaZimbabwe Linea del tempo:
Questa scala temporale mostra un grafico dal 1971 anno al 2009 anno. Honduras. I dati fino ad 1970 anno non disponibili. Il numero di osservazioni attuali secondo i date: 39.
La fonte (nome):
Indicatori dello sviluppo mondiale
La fonte (organizzazione):
World Bank staff estimates from original source: European Commission, Joint Research Centre (JRC)/Netherlands Environmental Assessment Agency (PBL). Emission Database for Global Atmospheric Research (EDGAR): http://edgar.jrc.ec.europa.eu/.
Categorie:
Energy & Mining, Environment
sono stati aggiornati
23 apr 2017 anni
Indicatori delle variazioni dei valori per anni
Minima:
6.963
1 gen 2004 anni
Massimo:
10.83
1 gen 1999 anni
Alla data di osservazione
Valore
Variazione assoluta
La variazione rispetto al valore precedente
1 gen 1971 anni
9.633
+9.633
0.0%
1 gen 1972 anni
9.254
-0.379
-3.93%
1 gen 1973 anni
9.352
+0.097
1.05%
1 gen 1974 anni
9.396
+0.044
0.47%
1 gen 1975 anni
8.767
-0.629
-6.69%
1 gen 1976 anni
8.718
-0.049
-0.56%
1 gen 1977 anni
8.97
+0.252
2.89%
1 gen 1978 anni
8.733
-0.237
-2.64%
1 gen 1979 anni
8.826
+0.093
1.06%
1 gen 1980 anni
8.279
-0.547
-6.2%
1 gen 1981 anni
8.651
+0.372
4.5%
1 gen 1982 anni
8.963
+0.312
3.61%
1 gen 1983 anni
8.182
-0.781
-8.72%
1 gen 1984 anni
7.87
-0.312
-3.81%
1 gen 1985 anni
7.527
-0.343
-4.36%
1 gen 1986 anni
7.683
+0.157
2.08%
1 gen 1987 anni
7.753
+0.07
0.91%
1 gen 1988 anni
7.66
-0.093
-1.2%
1 gen 1989 anni
8.084
+0.424
5.54%
1 gen 1990 anni
8.602
+0.519
6.41%
1 gen 1991 anni
8.808
+0.205
2.39%
1 gen 1992 anni
8.329
-0.478
-5.43%
1 gen 1993 anni
8.814
+0.485
5.82%
1 gen 1994 anni
9.058
+0.244
2.77%
1 gen 1995 anni
8.634
-0.424
-4.68%
1 gen 1996 anni
8.955
+0.321
3.72%
1 gen 1997 anni
8.751
-0.205
-2.29%
1 gen 1998 anni
10.452
+1.701
19.44%
1 gen 1999 anni
10.83
+0.379
3.62%
1 gen 2000 anni
9.688
-1.142
-10.55%
1 gen 2001 anni
9.145
-0.543
-5.6%
1 gen 2002 anni
9.127
-0.018
-0.2%
1 gen 2003 anni
9.391
+0.263
2.89%
1 gen 2004 anni
6.963
-2.427
-25.85%
1 gen 2005 anni
7.935
+0.971
13.95%
1 gen 2006 anni
7.503
-0.432
-5.44%
1 gen 2007 anni
8.125
+0.622
8.29%
1 gen 2008 anni
8.312
+0.187
2.3%
1 gen 2009 anni
8.486
+0.174
2.1%
Classificazione dei paesi secondo i statistiche attuali per anni


Commenti: