29
/it/
it
AIzaSyAYiBZKx7MnpbEhh9jyipgxe19OcubqV5w
April 1, 2024
28797
East Asia & Pacific (excluding high income)
EAP
false
2
1
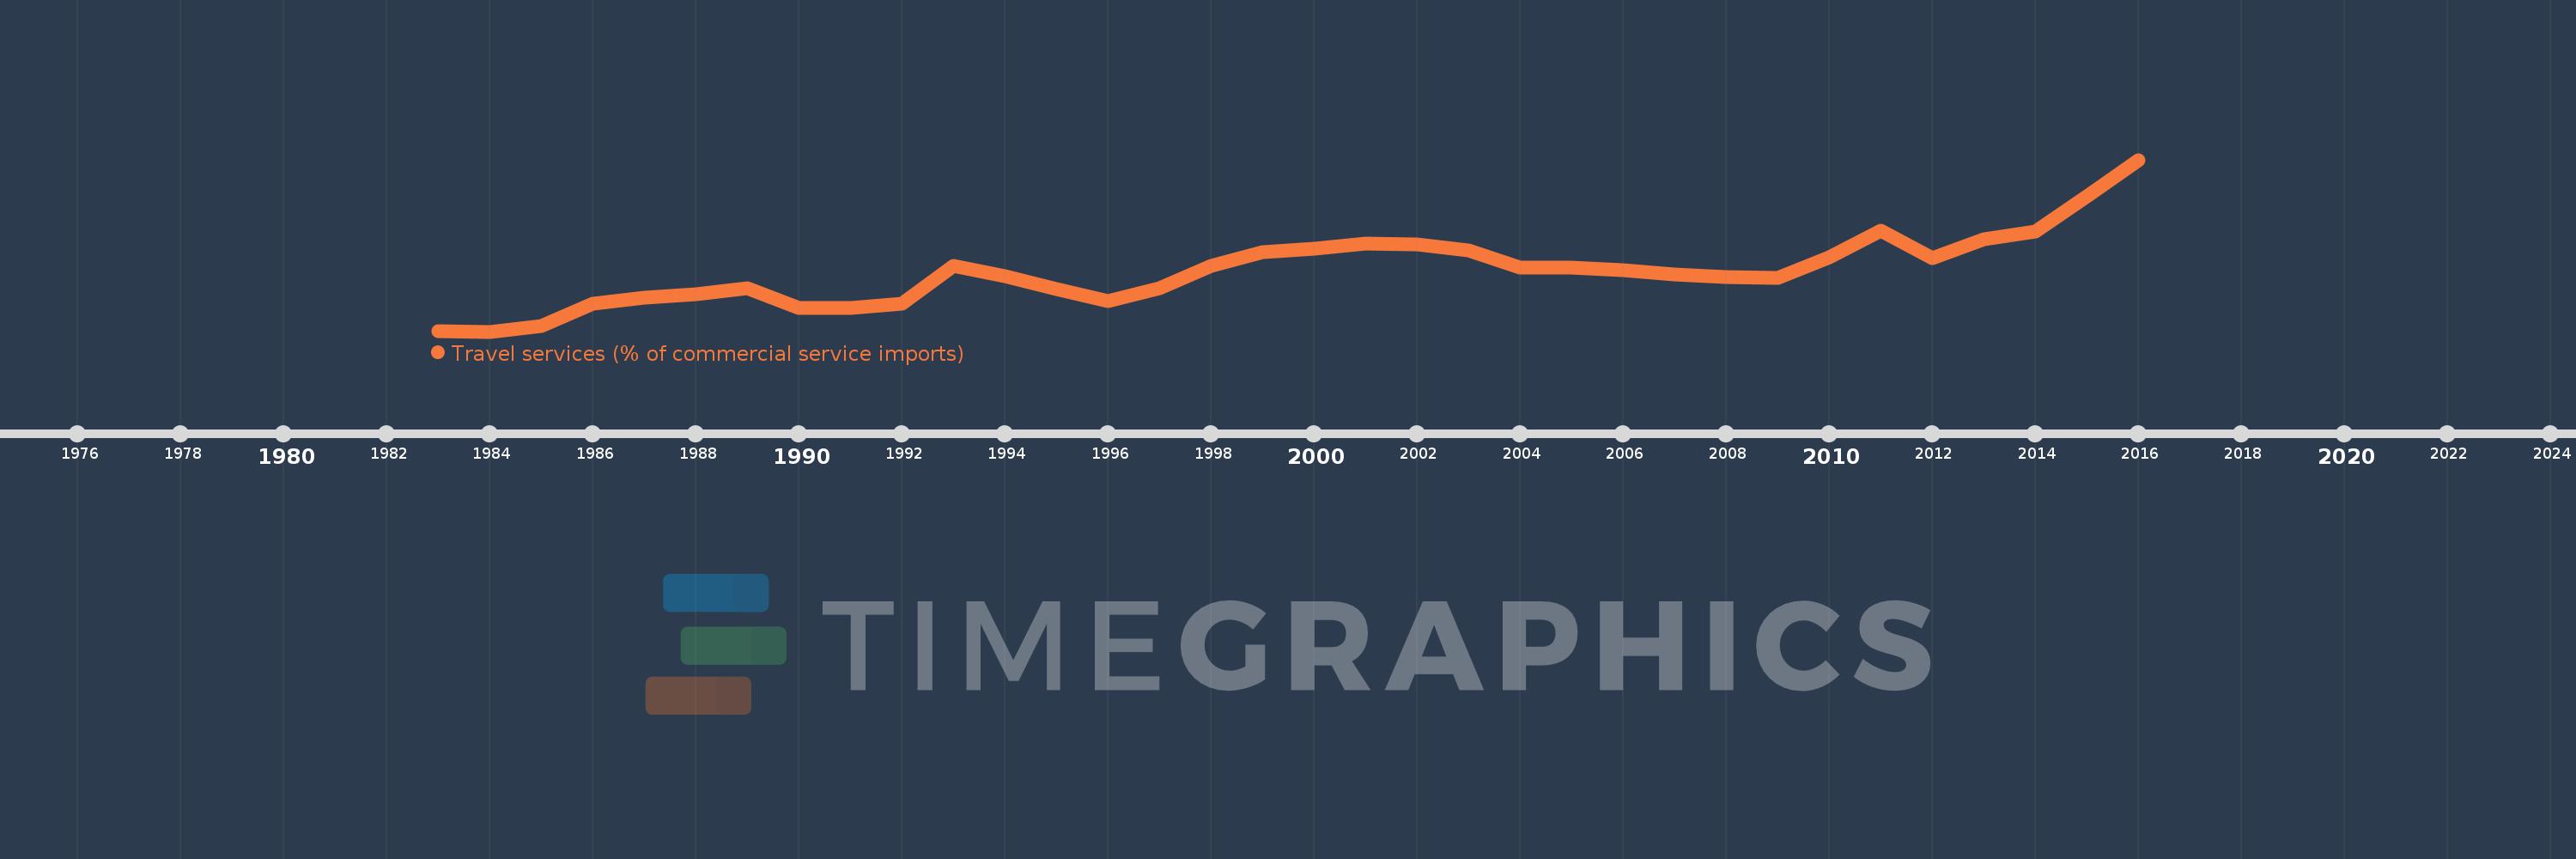
Travel services (% of commercial service imports)
2016,2015,2014,2013,2012,2011,2010,2009,2008,2007,2006,2005,2004,2003,2002,2001,2000,1999,1998,1997,1996,1995,1994,1993,1992,1991,1990,1989,1988,1987,1986,1985,1984,1983
Queste statistiche in altri paesi:
AfghanistanAlbaniaAlgeriaAngolaAntigua and BarbudaArab WorldArgentinaArmeniaArubaAustraliaAustriaAzerbaijanBahamas, TheBahrainBangladeshBarbadosBelarusBelgiumBelizeBeninBermudaBhutanBoliviaBosnia and HerzegovinaBotswanaBrazilBrunei DarussalamBulgariaBurkina FasoBurundiCabo VerdeCambodiaCameroonCanadaCaribbean small statesCentral African RepublicCentral Europe and the BalticsChadChileChinaColombiaComorosCongo, Dem. Rep.Congo, Rep.Costa RicaCote d'IvoireCroatiaCuracaoCyprusCzech RepublicDenmarkDjiboutiDominicaDominican RepublicEarly-demographic dividendEast Asia & PacificEast Asia & Pacific (excluding high income)East Asia & Pacific (IDA & IBRD countries)EcuadorEgypt, Arab Rep.El SalvadorEritreaEstoniaEthiopiaEuro areaEurope & Central AsiaEurope & Central Asia (excluding high income)Europe & Central Asia (IDA & IBRD countries)European UnionFaroe IslandsFijiFinlandFragile and conflict affected situationsFranceFrench PolynesiaGabonGambia, TheGeorgiaGermanyGhanaGreeceGrenadaGuatemalaGuineaGuinea-BissauGuyanaHaitiHeavily indebted poor countries (HIPC)High incomeHondurasHong Kong SAR, ChinaHungaryIBRD onlyIcelandIDA & IBRD totalIDA onlyIDA totalIndiaIndonesiaIran, Islamic Rep.IraqIrelandIsraelItalyJamaicaJapanJordanKazakhstanKenyaKiribatiKorea, Rep.KosovoKuwaitKyrgyz RepublicLao PDRLate-demographic dividendLatin America & Caribbean Latin America & Caribbean (excluding high income)Latin America & the Caribbean (IDA & IBRD countries)LatviaLeast developed countries: UN classificationLebanonLesothoLiberiaLibyaLithuaniaLow & middle incomeLow incomeLower middle incomeLuxembourgMacao SAR, ChinaMacedonia, FYRMadagascarMalawiMalaysiaMaldivesMaliMaltaMarshall IslandsMauritaniaMauritiusMexicoMicronesia, Fed. Sts.Middle East & North AfricaMiddle East & North Africa (excluding high income)Middle East & North Africa (IDA & IBRD countries)Middle incomeMoldovaMongoliaMontenegroMoroccoMozambiqueMyanmarNamibiaNepalNetherlandsNew CaledoniaNew ZealandNicaraguaNigerNigeriaNorth AmericaNorwayOECD membersOmanOther small statesPacific island small statesPakistanPalauPanamaPapua New GuineaParaguayPeruPhilippinesPolandPortugalPost-demographic dividendPre-demographic dividendQatarRomaniaRussian FederationRwandaSamoaSao Tome and PrincipeSaudi ArabiaSenegalSerbiaSeychellesSierra LeoneSingaporeSint Maarten (Dutch part)Slovak RepublicSloveniaSmall statesSolomon IslandsSouth AfricaSouth AsiaSouth Asia (IDA & IBRD)South SudanSpainSri LankaSt. Kitts and NevisSt. LuciaSt. Vincent and the GrenadinesSub-Saharan Africa Sub-Saharan Africa (excluding high income)Sub-Saharan Africa (IDA & IBRD countries)SudanSurinameSwazilandSwedenSwitzerlandSyrian Arab RepublicTajikistanTanzaniaThailandTimor-LesteTogoTongaTrinidad and TobagoTunisiaTurkeyTuvaluUgandaUkraineUnited KingdomUnited StatesUpper middle incomeUruguayVanuatuVenezuela, RBWest Bank and GazaWorldYemen, Rep.ZambiaZimbabwe Linea del tempo:
Questa scala temporale mostra un grafico dal 1983 anno al 2016 anno. East Asia & Pacific (excluding high income). I dati fino ad 1982 anno non disponibili. Il numero di osservazioni attuali secondo i date: 34.
La fonte (nome):
Indicatori dello sviluppo mondiale
La fonte (organizzazione):
International Monetary Fund, Balance of Payments Statistics Yearbook and data files.
Categorie:
Private Sector, Trade
sono stati aggiornati
23 apr 2017 anni
Indicatori delle variazioni dei valori per anni
Minima:
7.404
1 gen 1984 anni
Massimo:
53.929
1 gen 2016 anni
Alla data di osservazione
Valore
Variazione assoluta
La variazione rispetto al valore precedente
1 gen 1983 anni
7.482
+7.482
0.0%
1 gen 1984 anni
7.404
-0.079
-1.05%
1 gen 1985 anni
8.922
+1.518
20.5%
1 gen 1986 anni
15.01
+6.089
68.24%
1 gen 1987 anni
16.573
+1.563
10.41%
1 gen 1988 anni
17.625
+1.052
6.35%
1 gen 1989 anni
19.155
+1.53
8.68%
1 gen 1990 anni
13.869
-5.287
-27.6%
1 gen 1991 anni
13.897
+0.028
0.2%
1 gen 1992 anni
14.946
+1.049
7.55%
1 gen 1993 anni
25.126
+10.18
68.11%
1 gen 1994 anni
22.495
-2.631
-10.47%
1 gen 1995 anni
19.003
-3.492
-15.52%
1 gen 1996 anni
15.561
-3.443
-18.12%
1 gen 1997 anni
19.208
+3.648
23.44%
1 gen 1998 anni
25.254
+6.045
31.47%
1 gen 1999 anni
28.921
+3.668
14.52%
1 gen 2000 anni
29.844
+0.922
3.19%
1 gen 2001 anni
31.2
+1.356
4.54%
1 gen 2002 anni
31.059
-0.141
-0.45%
1 gen 2003 anni
29.302
-1.758
-5.66%
1 gen 2004 anni
24.7
-4.601
-15.7%
1 gen 2005 anni
24.647
-0.053
-0.21%
1 gen 2006 anni
24.045
-0.602
-2.44%
1 gen 2007 anni
22.861
-1.185
-4.93%
1 gen 2008 anni
22.251
-0.61
-2.67%
1 gen 2009 anni
22.041
-0.21
-0.94%
1 gen 2010 anni
27.636
+5.594
25.38%
1 gen 2011 anni
34.633
+6.997
25.32%
1 gen 2012 anni
27.237
-7.396
-21.35%
1 gen 2013 anni
32.43
+5.193
19.06%
1 gen 2014 anni
34.406
+1.977
6.1%
1 gen 2015 anni
44.007
+9.601
27.9%
1 gen 2016 anni
53.929
+9.922
22.55%
Classificazione dei paesi secondo i statistiche attuali per anni


Commenti: