29
/it/
it
AIzaSyAYiBZKx7MnpbEhh9jyipgxe19OcubqV5w
April 1, 2024
134697
France
FRA
true
2
1
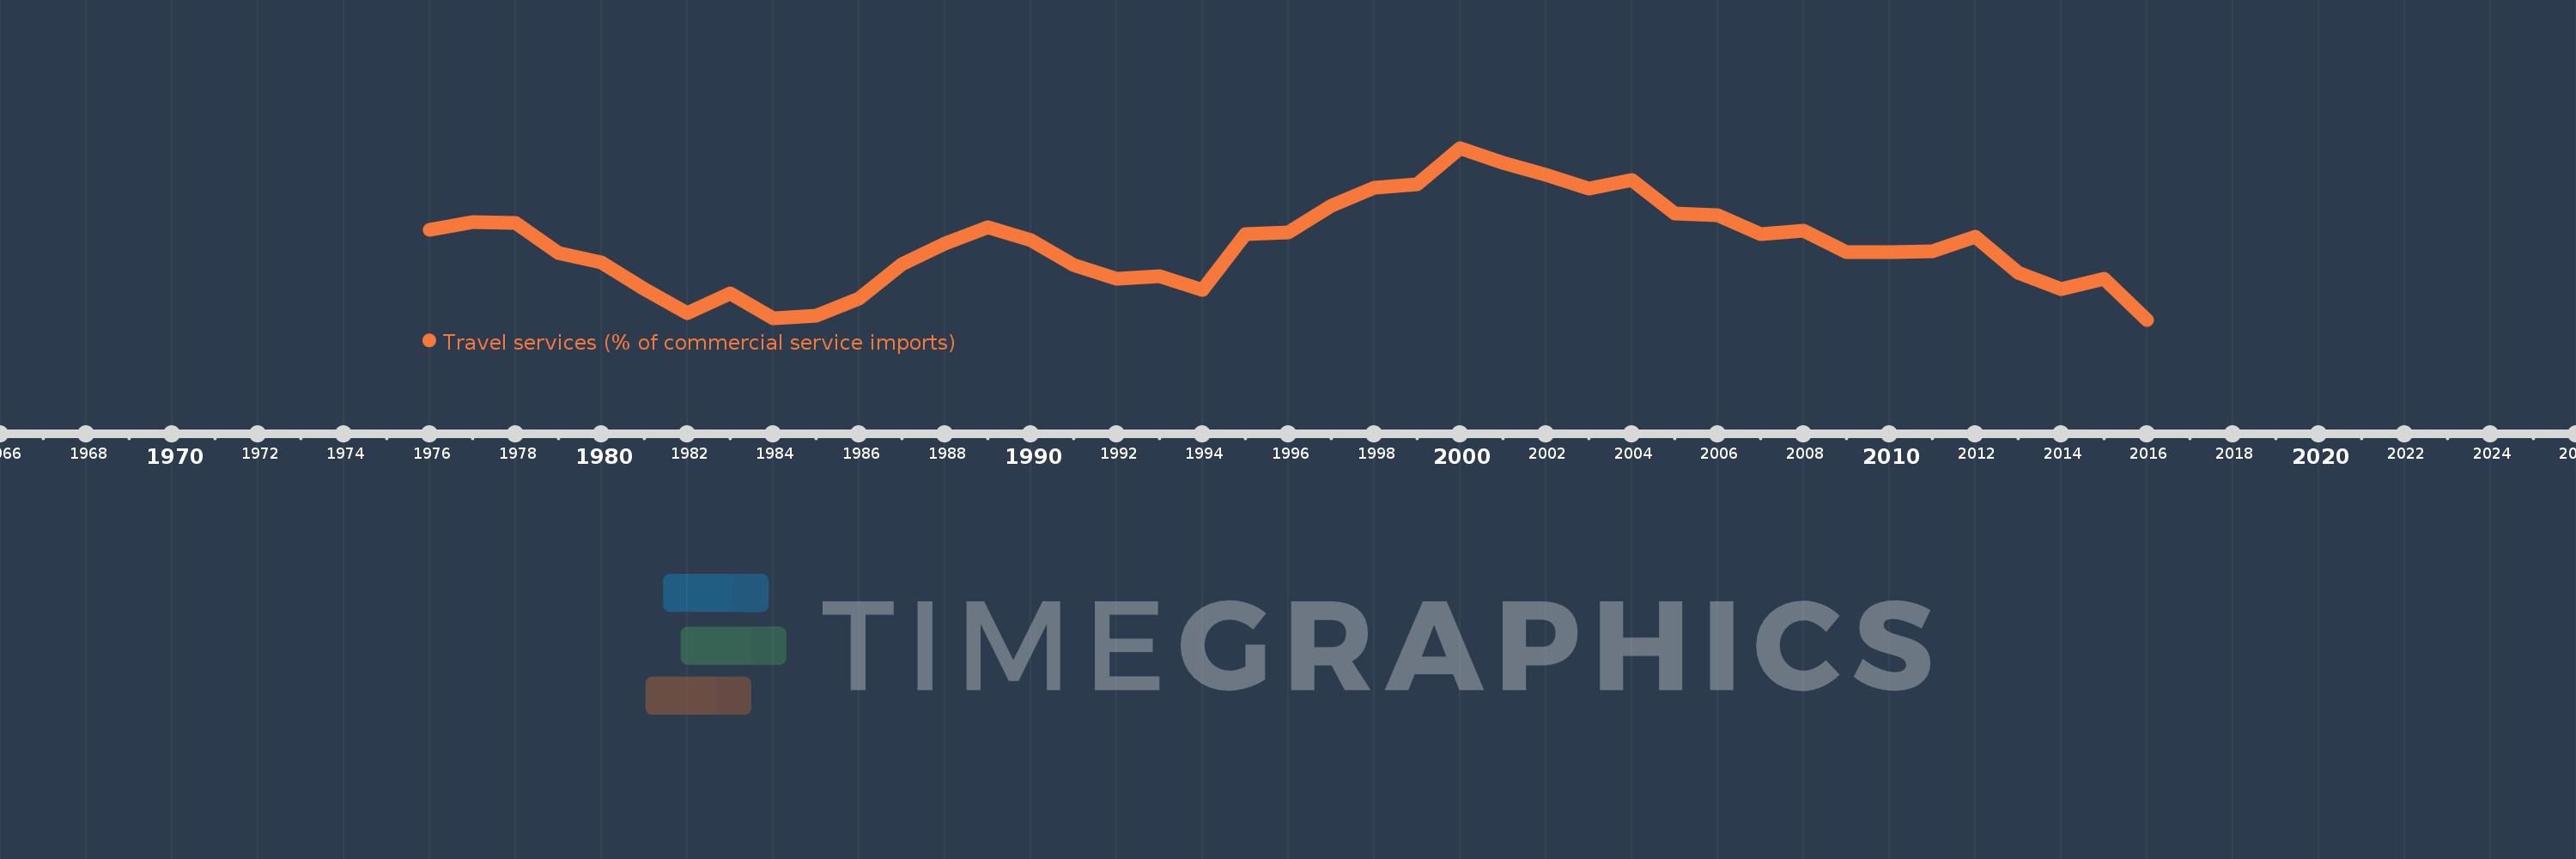
Travel services (% of commercial service imports)
2016,2015,2014,2013,2012,2011,2010,2009,2008,2007,2006,2005,2004,2003,2002,2001,2000,1999,1998,1997,1996,1995,1994,1993,1992,1991,1990,1989,1988,1987,1986,1985,1984,1983,1982,1981,1980,1979,1978,1977,1976
Queste statistiche in altri paesi:
AfghanistanAlbaniaAlgeriaAngolaAntigua and BarbudaArab WorldArgentinaArmeniaArubaAustraliaAustriaAzerbaijanBahamas, TheBahrainBangladeshBarbadosBelarusBelgiumBelizeBeninBermudaBhutanBoliviaBosnia and HerzegovinaBotswanaBrazilBrunei DarussalamBulgariaBurkina FasoBurundiCabo VerdeCambodiaCameroonCanadaCaribbean small statesCentral African RepublicCentral Europe and the BalticsChadChileChinaColombiaComorosCongo, Dem. Rep.Congo, Rep.Costa RicaCote d'IvoireCroatiaCuracaoCyprusCzech RepublicDenmarkDjiboutiDominicaDominican RepublicEarly-demographic dividendEast Asia & PacificEast Asia & Pacific (excluding high income)East Asia & Pacific (IDA & IBRD countries)EcuadorEgypt, Arab Rep.El SalvadorEritreaEstoniaEthiopiaEuro areaEurope & Central AsiaEurope & Central Asia (excluding high income)Europe & Central Asia (IDA & IBRD countries)European UnionFaroe IslandsFijiFinlandFragile and conflict affected situationsFranceFrench PolynesiaGabonGambia, TheGeorgiaGermanyGhanaGreeceGrenadaGuatemalaGuineaGuinea-BissauGuyanaHaitiHeavily indebted poor countries (HIPC)High incomeHondurasHong Kong SAR, ChinaHungaryIBRD onlyIcelandIDA & IBRD totalIDA onlyIDA totalIndiaIndonesiaIran, Islamic Rep.IraqIrelandIsraelItalyJamaicaJapanJordanKazakhstanKenyaKiribatiKorea, Rep.KosovoKuwaitKyrgyz RepublicLao PDRLate-demographic dividendLatin America & Caribbean Latin America & Caribbean (excluding high income)Latin America & the Caribbean (IDA & IBRD countries)LatviaLeast developed countries: UN classificationLebanonLesothoLiberiaLibyaLithuaniaLow & middle incomeLow incomeLower middle incomeLuxembourgMacao SAR, ChinaMacedonia, FYRMadagascarMalawiMalaysiaMaldivesMaliMaltaMarshall IslandsMauritaniaMauritiusMexicoMicronesia, Fed. Sts.Middle East & North AfricaMiddle East & North Africa (excluding high income)Middle East & North Africa (IDA & IBRD countries)Middle incomeMoldovaMongoliaMontenegroMoroccoMozambiqueMyanmarNamibiaNepalNetherlandsNew CaledoniaNew ZealandNicaraguaNigerNigeriaNorth AmericaNorwayOECD membersOmanOther small statesPacific island small statesPakistanPalauPanamaPapua New GuineaParaguayPeruPhilippinesPolandPortugalPost-demographic dividendPre-demographic dividendQatarRomaniaRussian FederationRwandaSamoaSao Tome and PrincipeSaudi ArabiaSenegalSerbiaSeychellesSierra LeoneSingaporeSint Maarten (Dutch part)Slovak RepublicSloveniaSmall statesSolomon IslandsSouth AfricaSouth AsiaSouth Asia (IDA & IBRD)South SudanSpainSri LankaSt. Kitts and NevisSt. LuciaSt. Vincent and the GrenadinesSub-Saharan Africa Sub-Saharan Africa (excluding high income)Sub-Saharan Africa (IDA & IBRD countries)SudanSurinameSwazilandSwedenSwitzerlandSyrian Arab RepublicTajikistanTanzaniaThailandTimor-LesteTogoTongaTrinidad and TobagoTunisiaTurkeyTuvaluUgandaUkraineUnited KingdomUnited StatesUpper middle incomeUruguayVanuatuVenezuela, RBWest Bank and GazaWorldYemen, Rep.ZambiaZimbabwe Linea del tempo:
Questa scala temporale mostra un grafico dal 1976 anno al 2016 anno. France. I dati fino ad 1975 anno non disponibili. Il numero di osservazioni attuali secondo i date: 41.
La fonte (nome):
Indicatori dello sviluppo mondiale
La fonte (organizzazione):
International Monetary Fund, Balance of Payments Statistics Yearbook and data files.
Categorie:
Private Sector, Trade
sono stati aggiornati
23 apr 2017 anni
Indicatori delle variazioni dei valori per anni
Minima:
16.628
1 gen 2016 anni
Massimo:
27.977
1 gen 2000 anni
Alla data di osservazione
Valore
Variazione assoluta
La variazione rispetto al valore precedente
1 gen 1976 anni
22.59
+22.59
0.0%
1 gen 1977 anni
23.064
+0.475
2.1%
1 gen 1978 anni
23.0
-0.065
-0.28%
1 gen 1979 anni
21.037
-1.963
-8.53%
1 gen 1980 anni
20.42
-0.617
-2.93%
1 gen 1981 anni
18.659
-1.761
-8.63%
1 gen 1982 anni
17.066
-1.592
-8.53%
1 gen 1983 anni
18.361
+1.295
7.59%
1 gen 1984 anni
16.748
-1.613
-8.78%
1 gen 1985 anni
16.913
+0.164
0.98%
1 gen 1986 anni
18.056
+1.143
6.76%
1 gen 1987 anni
20.275
+2.219
12.29%
1 gen 1988 anni
21.669
+1.394
6.88%
1 gen 1989 anni
22.721
+1.052
4.86%
1 gen 1990 anni
21.897
-0.824
-3.63%
1 gen 1991 anni
20.246
-1.651
-7.54%
1 gen 1992 anni
19.342
-0.904
-4.47%
1 gen 1993 anni
19.49
+0.148
0.77%
1 gen 1994 anni
18.591
-0.899
-4.61%
1 gen 1995 anni
22.312
+3.721
20.01%
1 gen 1996 anni
22.421
+0.109
0.49%
1 gen 1997 anni
24.155
+1.734
7.73%
1 gen 1998 anni
25.354
+1.199
4.97%
1 gen 1999 anni
25.558
+0.203
0.8%
1 gen 2000 anni
27.977
+2.419
9.47%
1 gen 2001 anni
26.984
-0.993
-3.55%
1 gen 2002 anni
26.209
-0.775
-2.87%
1 gen 2003 anni
25.284
-0.925
-3.53%
1 gen 2004 anni
25.846
+0.562
2.22%
1 gen 2005 anni
23.667
-2.179
-8.43%
1 gen 2006 anni
23.509
-0.158
-0.67%
1 gen 2007 anni
22.263
-1.246
-5.3%
1 gen 2008 anni
22.537
+0.275
1.23%
1 gen 2009 anni
21.108
-1.429
-6.34%
1 gen 2010 anni
21.101
-0.007
-0.03%
1 gen 2011 anni
21.17
+0.069
0.33%
1 gen 2012 anni
22.102
+0.932
4.4%
1 gen 2013 anni
19.717
-2.385
-10.79%
1 gen 2014 anni
18.641
-1.076
-5.46%
1 gen 2015 anni
19.35
+0.709
3.8%
1 gen 2016 anni
16.628
-2.722
-14.07%
Classificazione dei paesi secondo i statistiche attuali per anni


Commenti: