29
/it/
it
AIzaSyAYiBZKx7MnpbEhh9jyipgxe19OcubqV5w
April 1, 2024
105564
Chile
CHL
true
2
1
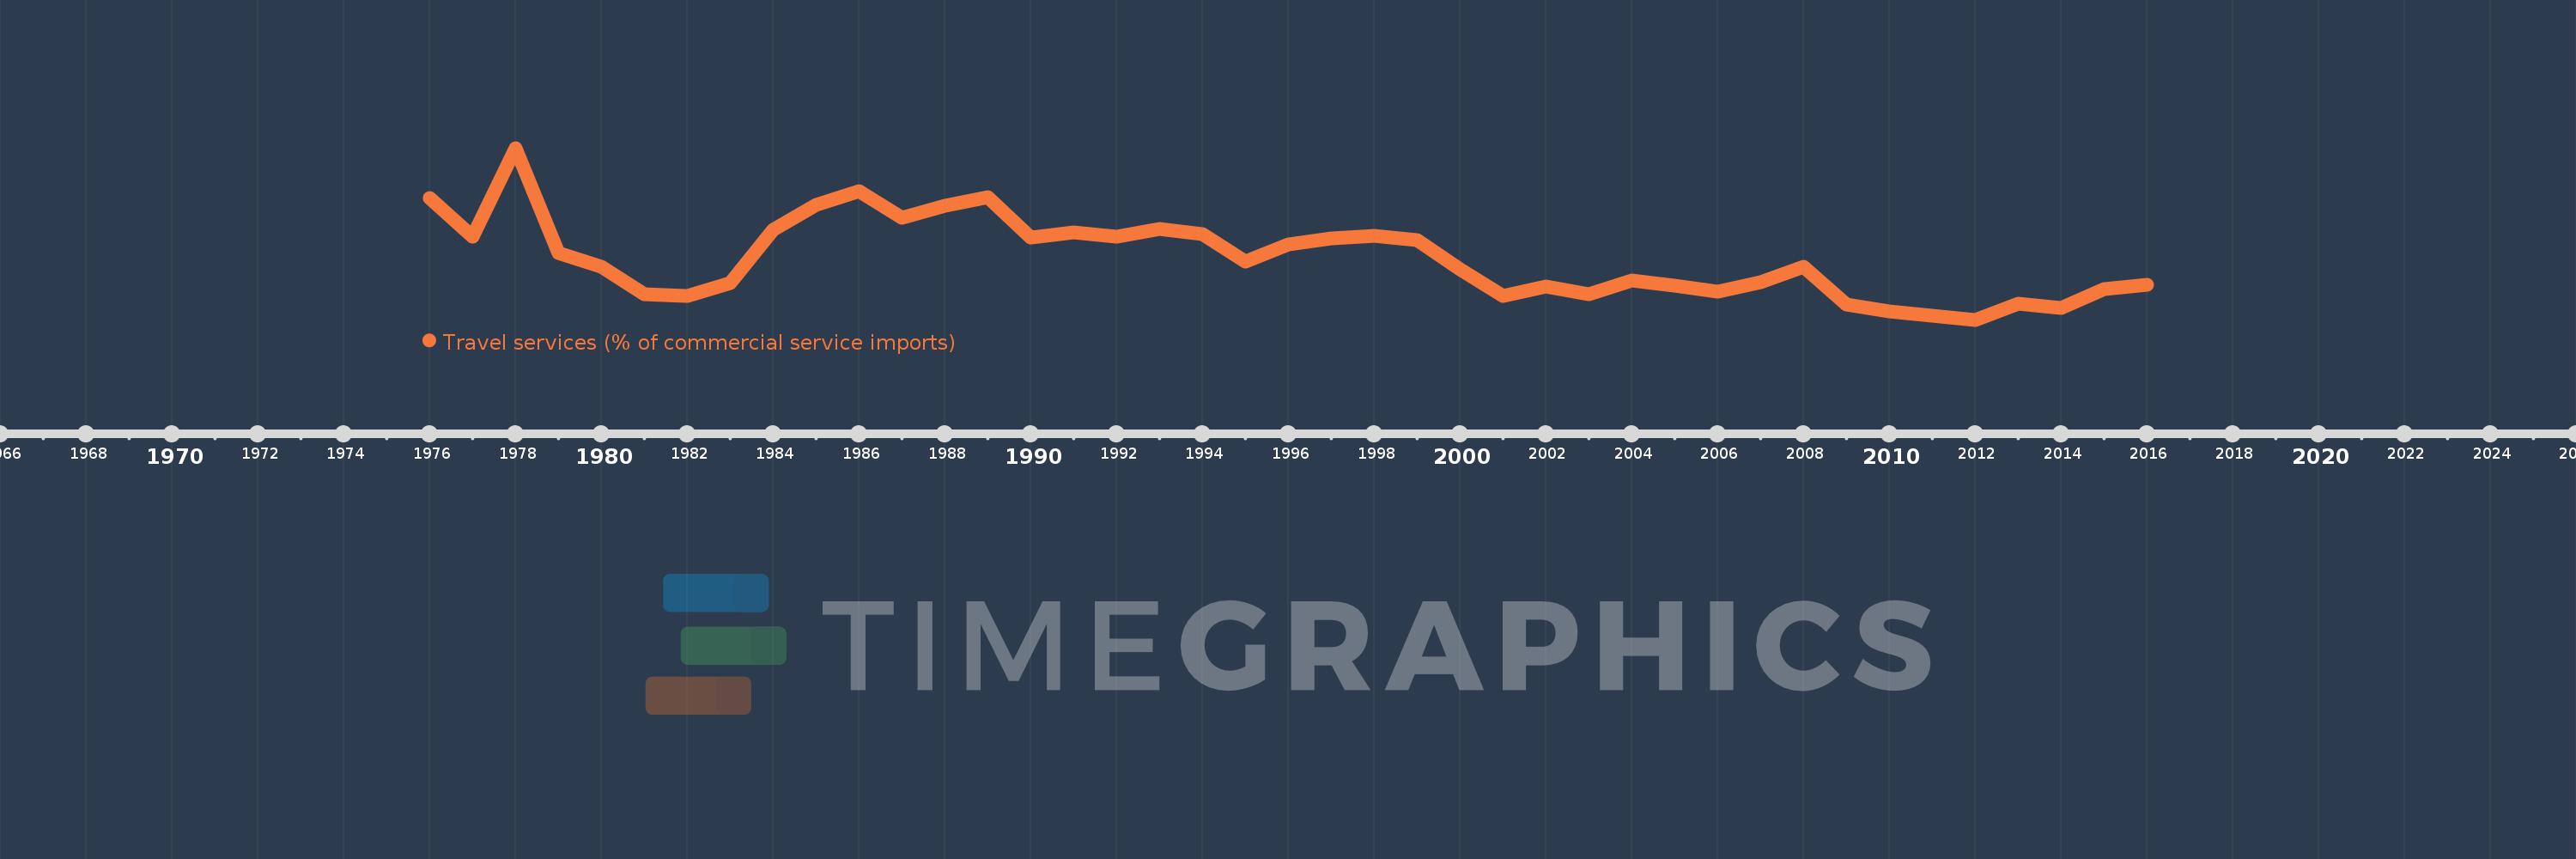
Travel services (% of commercial service imports)
2016,2015,2014,2013,2012,2011,2010,2009,2008,2007,2006,2005,2004,2003,2002,2001,2000,1999,1998,1997,1996,1995,1994,1993,1992,1991,1990,1989,1988,1987,1986,1985,1984,1983,1982,1981,1980,1979,1978,1977,1976
Queste statistiche in altri paesi:
AfghanistanAlbaniaAlgeriaAngolaAntigua and BarbudaArab WorldArgentinaArmeniaArubaAustraliaAustriaAzerbaijanBahamas, TheBahrainBangladeshBarbadosBelarusBelgiumBelizeBeninBermudaBhutanBoliviaBosnia and HerzegovinaBotswanaBrazilBrunei DarussalamBulgariaBurkina FasoBurundiCabo VerdeCambodiaCameroonCanadaCaribbean small statesCentral African RepublicCentral Europe and the BalticsChadChileChinaColombiaComorosCongo, Dem. Rep.Congo, Rep.Costa RicaCote d'IvoireCroatiaCuracaoCyprusCzech RepublicDenmarkDjiboutiDominicaDominican RepublicEarly-demographic dividendEast Asia & PacificEast Asia & Pacific (excluding high income)East Asia & Pacific (IDA & IBRD countries)EcuadorEgypt, Arab Rep.El SalvadorEritreaEstoniaEthiopiaEuro areaEurope & Central AsiaEurope & Central Asia (excluding high income)Europe & Central Asia (IDA & IBRD countries)European UnionFaroe IslandsFijiFinlandFragile and conflict affected situationsFranceFrench PolynesiaGabonGambia, TheGeorgiaGermanyGhanaGreeceGrenadaGuatemalaGuineaGuinea-BissauGuyanaHaitiHeavily indebted poor countries (HIPC)High incomeHondurasHong Kong SAR, ChinaHungaryIBRD onlyIcelandIDA & IBRD totalIDA onlyIDA totalIndiaIndonesiaIran, Islamic Rep.IraqIrelandIsraelItalyJamaicaJapanJordanKazakhstanKenyaKiribatiKorea, Rep.KosovoKuwaitKyrgyz RepublicLao PDRLate-demographic dividendLatin America & Caribbean Latin America & Caribbean (excluding high income)Latin America & the Caribbean (IDA & IBRD countries)LatviaLeast developed countries: UN classificationLebanonLesothoLiberiaLibyaLithuaniaLow & middle incomeLow incomeLower middle incomeLuxembourgMacao SAR, ChinaMacedonia, FYRMadagascarMalawiMalaysiaMaldivesMaliMaltaMarshall IslandsMauritaniaMauritiusMexicoMicronesia, Fed. Sts.Middle East & North AfricaMiddle East & North Africa (excluding high income)Middle East & North Africa (IDA & IBRD countries)Middle incomeMoldovaMongoliaMontenegroMoroccoMozambiqueMyanmarNamibiaNepalNetherlandsNew CaledoniaNew ZealandNicaraguaNigerNigeriaNorth AmericaNorwayOECD membersOmanOther small statesPacific island small statesPakistanPalauPanamaPapua New GuineaParaguayPeruPhilippinesPolandPortugalPost-demographic dividendPre-demographic dividendQatarRomaniaRussian FederationRwandaSamoaSao Tome and PrincipeSaudi ArabiaSenegalSerbiaSeychellesSierra LeoneSingaporeSint Maarten (Dutch part)Slovak RepublicSloveniaSmall statesSolomon IslandsSouth AfricaSouth AsiaSouth Asia (IDA & IBRD)South SudanSpainSri LankaSt. Kitts and NevisSt. LuciaSt. Vincent and the GrenadinesSub-Saharan Africa Sub-Saharan Africa (excluding high income)Sub-Saharan Africa (IDA & IBRD countries)SudanSurinameSwazilandSwedenSwitzerlandSyrian Arab RepublicTajikistanTanzaniaThailandTimor-LesteTogoTongaTrinidad and TobagoTunisiaTurkeyTuvaluUgandaUkraineUnited KingdomUnited StatesUpper middle incomeUruguayVanuatuVenezuela, RBWest Bank and GazaWorldYemen, Rep.ZambiaZimbabwe Linea del tempo:
Questa scala temporale mostra un grafico dal 1976 anno al 2016 anno. Chile. I dati fino ad 1975 anno non disponibili. Il numero di osservazioni attuali secondo i date: 41.
La fonte (nome):
Indicatori dello sviluppo mondiale
La fonte (organizzazione):
International Monetary Fund, Balance of Payments Statistics Yearbook and data files.
Categorie:
Private Sector, Trade
sono stati aggiornati
23 apr 2017 anni
Indicatori delle variazioni dei valori per anni
Minima:
10.053
1 gen 2012 anni
Massimo:
32.54
1 gen 1978 anni
Alla data di osservazione
Valore
Variazione assoluta
La variazione rispetto al valore precedente
1 gen 1976 anni
26.037
+26.037
0.0%
1 gen 1977 anni
20.952
-5.084
-19.53%
1 gen 1978 anni
32.54
+11.587
55.3%
1 gen 1979 anni
18.759
-13.781
-42.35%
1 gen 1980 anni
17.01
-1.749
-9.32%
1 gen 1981 anni
13.405
-3.605
-21.2%
1 gen 1982 anni
13.126
-0.278
-2.08%
1 gen 1983 anni
14.908
+1.782
13.57%
1 gen 1984 anni
21.774
+6.866
46.05%
1 gen 1985 anni
25.045
+3.271
15.02%
1 gen 1986 anni
26.931
+1.886
7.53%
1 gen 1987 anni
23.451
-3.48
-12.92%
1 gen 1988 anni
24.968
+1.517
6.47%
1 gen 1989 anni
26.131
+1.163
4.66%
1 gen 1990 anni
20.764
-5.367
-20.54%
1 gen 1991 anni
21.491
+0.728
3.5%
1 gen 1992 anni
20.953
-0.538
-2.51%
1 gen 1993 anni
21.898
+0.945
4.51%
1 gen 1994 anni
21.296
-0.602
-2.75%
1 gen 1995 anni
17.666
-3.63
-17.05%
1 gen 1996 anni
19.949
+2.283
12.92%
1 gen 1997 anni
20.679
+0.73
3.66%
1 gen 1998 anni
21.086
+0.407
1.97%
1 gen 1999 anni
20.486
-0.6
-2.85%
1 gen 2000 anni
16.616
-3.87
-18.89%
1 gen 2001 anni
13.114
-3.503
-21.08%
1 gen 2002 anni
14.394
+1.28
9.76%
1 gen 2003 anni
13.443
-0.95
-6.6%
1 gen 2004 anni
15.154
+1.711
12.72%
1 gen 2005 anni
14.543
-0.611
-4.03%
1 gen 2006 anni
13.762
-0.781
-5.37%
1 gen 2007 anni
14.955
+1.194
8.67%
1 gen 2008 anni
16.95
+1.995
13.34%
1 gen 2009 anni
12.061
-4.889
-28.85%
1 gen 2010 anni
11.113
-0.948
-7.86%
1 gen 2011 anni
10.614
-0.498
-4.48%
1 gen 2012 anni
10.053
-0.562
-5.29%
1 gen 2013 anni
12.111
+2.059
20.48%
1 gen 2014 anni
11.609
-0.502
-4.15%
1 gen 2015 anni
14.086
+2.477
21.33%
1 gen 2016 anni
14.614
+0.528
3.75%
Classificazione dei paesi secondo i statistiche attuali per anni


Commenti: