29
/it/
it
AIzaSyAYiBZKx7MnpbEhh9jyipgxe19OcubqV5w
April 1, 2024
287364
Zimbabwe
ZWE
true
2
1
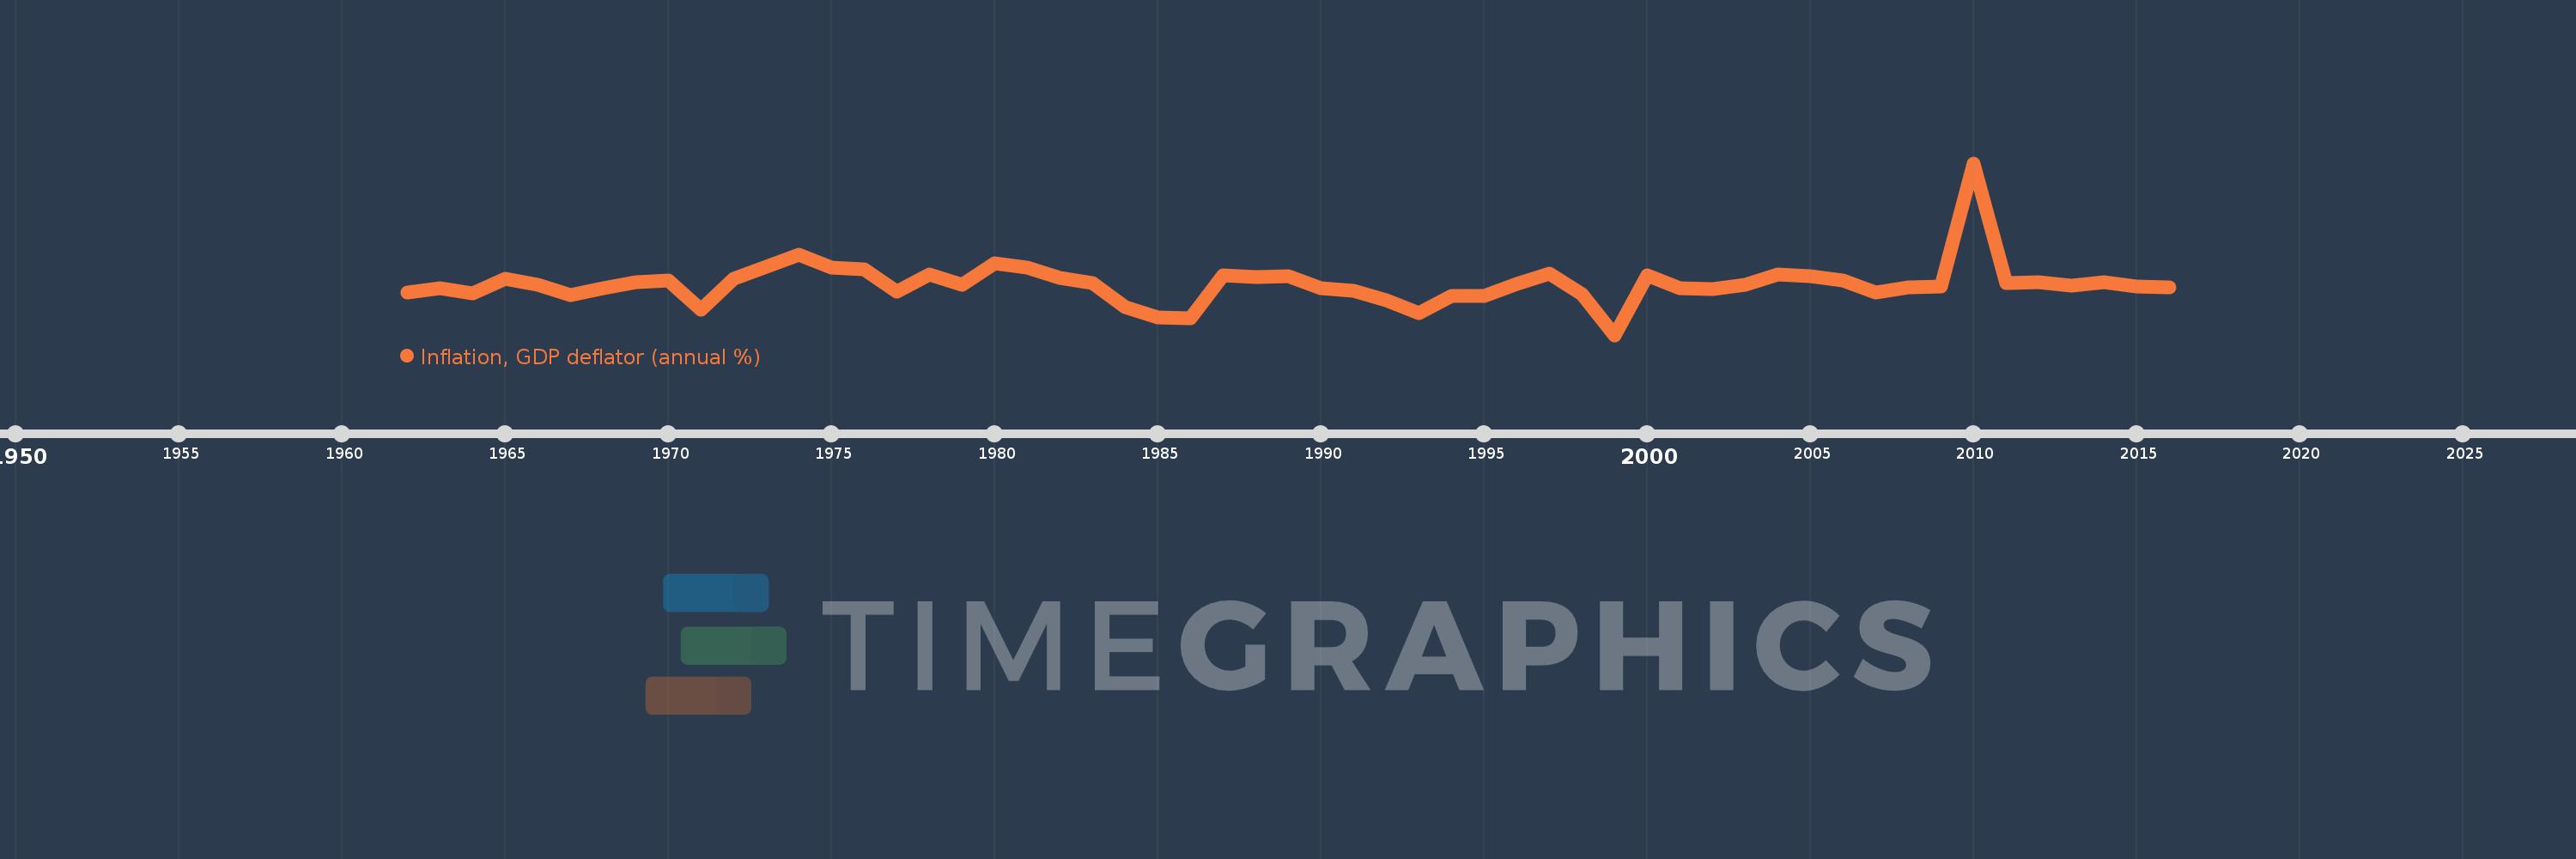
Inflation, GDP deflator (annual %)
2016,2015,2014,2013,2012,2011,2010,2009,2008,2007,2006,2005,2004,2003,2002,2001,2000,1999,1998,1997,1996,1995,1994,1993,1992,1991,1990,1989,1988,1987,1986,1985,1984,1983,1982,1981,1980,1979,1978,1977,1976,1975,1974,1973,1972,1971,1970,1969,1968,1967,1966,1965,1964,1963,1962
Queste statistiche in altri paesi:
AfghanistanAlbaniaAlgeriaAndorraAngolaAntigua and BarbudaArab WorldArgentinaArmeniaArubaAustraliaAustriaAzerbaijanBahamas, TheBahrainBangladeshBarbadosBelarusBelgiumBelizeBeninBermudaBhutanBoliviaBosnia and HerzegovinaBotswanaBrazilBrunei DarussalamBulgariaBurkina FasoBurundiCabo VerdeCambodiaCameroonCanadaCaribbean small statesCayman IslandsCentral African RepublicCentral Europe and the BalticsChadChannel IslandsChileChinaColombiaComorosCongo, Dem. Rep.Congo, Rep.Costa RicaCote d'IvoireCroatiaCubaCyprusCzech RepublicDenmarkDjiboutiDominicaDominican RepublicEarly-demographic dividendEast Asia & PacificEast Asia & Pacific (excluding high income)East Asia & Pacific (IDA & IBRD countries)EcuadorEgypt, Arab Rep.El SalvadorEquatorial GuineaEritreaEstoniaEthiopiaEuro areaEurope & Central AsiaEurope & Central Asia (excluding high income)Europe & Central Asia (IDA & IBRD countries)European UnionFijiFinlandFragile and conflict affected situationsFranceFrench PolynesiaGabonGambia, TheGeorgiaGermanyGhanaGreeceGreenlandGrenadaGuatemalaGuineaGuinea-BissauGuyanaHaitiHeavily indebted poor countries (HIPC)High incomeHondurasHong Kong SAR, ChinaHungaryIBRD onlyIcelandIDA & IBRD totalIDA blendIDA onlyIDA totalIndiaIndonesiaIran, Islamic Rep.IraqIrelandIsle of ManIsraelItalyJamaicaJapanJordanKazakhstanKenyaKiribatiKorea, Rep.KosovoKuwaitKyrgyz RepublicLao PDRLate-demographic dividendLatin America & Caribbean Latin America & Caribbean (excluding high income)Latin America & the Caribbean (IDA & IBRD countries)LatviaLeast developed countries: UN classificationLebanonLesothoLiberiaLibyaLiechtensteinLithuaniaLow & middle incomeLow incomeLower middle incomeLuxembourgMacao SAR, ChinaMacedonia, FYRMadagascarMalawiMalaysiaMaldivesMaliMaltaMarshall IslandsMauritaniaMauritiusMexicoMicronesia, Fed. Sts.Middle East & North AfricaMiddle East & North Africa (excluding high income)Middle East & North Africa (IDA & IBRD countries)Middle incomeMoldovaMonacoMongoliaMontenegroMoroccoMozambiqueMyanmarNamibiaNauruNepalNetherlandsNew CaledoniaNew ZealandNicaraguaNigerNigeriaNorth AmericaNorwayOECD membersOmanOther small statesPacific island small statesPakistanPalauPanamaPapua New GuineaParaguayPeruPhilippinesPolandPortugalPost-demographic dividendPre-demographic dividendPuerto RicoQatarRomaniaRussian FederationRwandaSamoaSan MarinoSao Tome and PrincipeSaudi ArabiaSenegalSerbiaSeychellesSierra LeoneSingaporeSlovak RepublicSloveniaSmall statesSolomon IslandsSomaliaSouth AfricaSouth AsiaSouth Asia (IDA & IBRD)South SudanSpainSri LankaSt. Kitts and NevisSt. LuciaSt. Vincent and the GrenadinesSub-Saharan Africa Sub-Saharan Africa (excluding high income)Sub-Saharan Africa (IDA & IBRD countries)SudanSurinameSwazilandSwedenSwitzerlandSyrian Arab RepublicTajikistanTanzaniaThailandTimor-LesteTogoTongaTrinidad and TobagoTunisiaTurkeyTurkmenistanTuvaluUgandaUkraineUnited Arab EmiratesUnited KingdomUnited StatesUpper middle incomeUruguayUzbekistanVanuatuVenezuela, RBVietnamVirgin Islands (U.S.)West Bank and GazaWorldYemen, Rep.ZambiaZimbabwe Linea del tempo:
Questa scala temporale mostra un grafico dal 1962 anno al 2016 anno. Zimbabwe. I dati fino ad 1961 anno non disponibili. Il numero di osservazioni attuali secondo i date: 55.
La fonte (nome):
Indicatori dello sviluppo mondiale
La fonte (organizzazione):
World Bank national accounts data, and OECD National Accounts data files.
Categorie:
Economy & Growth
sono stati aggiornati
23 apr 2017 anni
Indicatori delle variazioni dei valori per anni
Minima:
-27.049
1 gen 1999 anni
Massimo:
74.298
1 gen 2010 anni
Alla data di osservazione
Valore
Variazione assoluta
La variazione rispetto al valore precedente
1 gen 1962 anni
-2.041
-2.041
0.0%
1 gen 1963 anni
0.47
+2.511
-123.01%
1 gen 1964 anni
-2.348
-2.817
-599.93%
1 gen 1965 anni
6.144
+8.492
-361.7%
1 gen 1966 anni
2.704
-3.44
-55.99%
1 gen 1967 anni
-3.73
-6.434
-237.94%
1 gen 1968 anni
0.577
+4.307
-115.46%
1 gen 1969 anni
3.866
+3.29
570.56%
1 gen 1970 anni
5.08
+1.214
31.4%
1 gen 1971 anni
-12.053
-17.133
-337.25%
1 gen 1972 anni
6.163
+18.216
-151.13%
1 gen 1973 anni
13.454
+7.29
118.29%
1 gen 1974 anni
20.451
+6.997
52.01%
1 gen 1975 anni
12.854
-7.597
-37.15%
1 gen 1976 anni
11.934
-0.92
-7.16%
1 gen 1977 anni
-1.668
-13.602
-113.98%
1 gen 1978 anni
8.51
+10.178
-610.22%
1 gen 1979 anni
2.481
-6.029
-70.84%
1 gen 1980 anni
15.181
+12.7
511.82%
1 gen 1981 anni
12.741
-2.44
-16.07%
1 gen 1982 anni
6.599
-6.142
-48.21%
1 gen 1983 anni
3.859
-2.74
-41.53%
1 gen 1984 anni
-10.502
-14.36
-372.15%
1 gen 1985 anni
-16.595
-6.093
58.02%
1 gen 1986 anni
-17.017
-0.422
2.54%
1 gen 1987 anni
8.026
+25.043
-147.16%
1 gen 1988 anni
7.189
-0.837
-10.42%
1 gen 1989 anni
7.785
+0.596
8.29%
1 gen 1990 anni
0.793
-6.992
-89.81%
1 gen 1991 anni
-0.92
-1.713
-216.08%
1 gen 1992 anni
-6.777
-5.857
636.32%
1 gen 1993 anni
-14.13
-7.352
108.49%
1 gen 1994 anni
-3.791
+10.339
-73.17%
1 gen 1995 anni
-3.896
-0.105
2.76%
1 gen 1996 anni
3.039
+6.934
-178.0%
1 gen 1997 anni
8.984
+5.946
195.68%
1 gen 1998 anni
-2.879
-11.863
-132.05%
1 gen 1999 anni
-27.049
-24.17
839.5%
1 gen 2000 anni
8.007
+35.055
-129.6%
1 gen 2001 anni
0.628
-7.379
-92.16%
1 gen 2002 anni
-0.131
-0.759
-120.85%
1 gen 2003 anni
2.713
+2.844
-2.17 Mille.%
1 gen 2004 anni
8.801
+6.088
224.42%
1 gen 2005 anni
7.612
-1.19
-13.52%
1 gen 2006 anni
5.137
-2.475
-32.52%
1 gen 2007 anni
-2.018
-7.154
-139.28%
1 gen 2008 anni
0.895
+2.913
-144.35%
1 gen 2009 anni
1.349
+0.454
50.77%
1 gen 2010 anni
74.298
+72.949
5.41 Mille.%
1 gen 2011 anni
3.711
-70.587
-95.01%
1 gen 2012 anni
3.91
+0.2
5.38%
1 gen 2013 anni
2.303
-1.608
-41.12%
1 gen 2014 anni
4.184
+1.882
81.72%
1 gen 2015 anni
1.339
-2.846
-68.01%
1 gen 2016 anni
1.086
-0.252
-18.86%
Classificazione dei paesi secondo i statistiche attuali per anni


Commenti: