29
/it/
it
AIzaSyAYiBZKx7MnpbEhh9jyipgxe19OcubqV5w
April 1, 2024
222341
Peru
PER
true
2
1
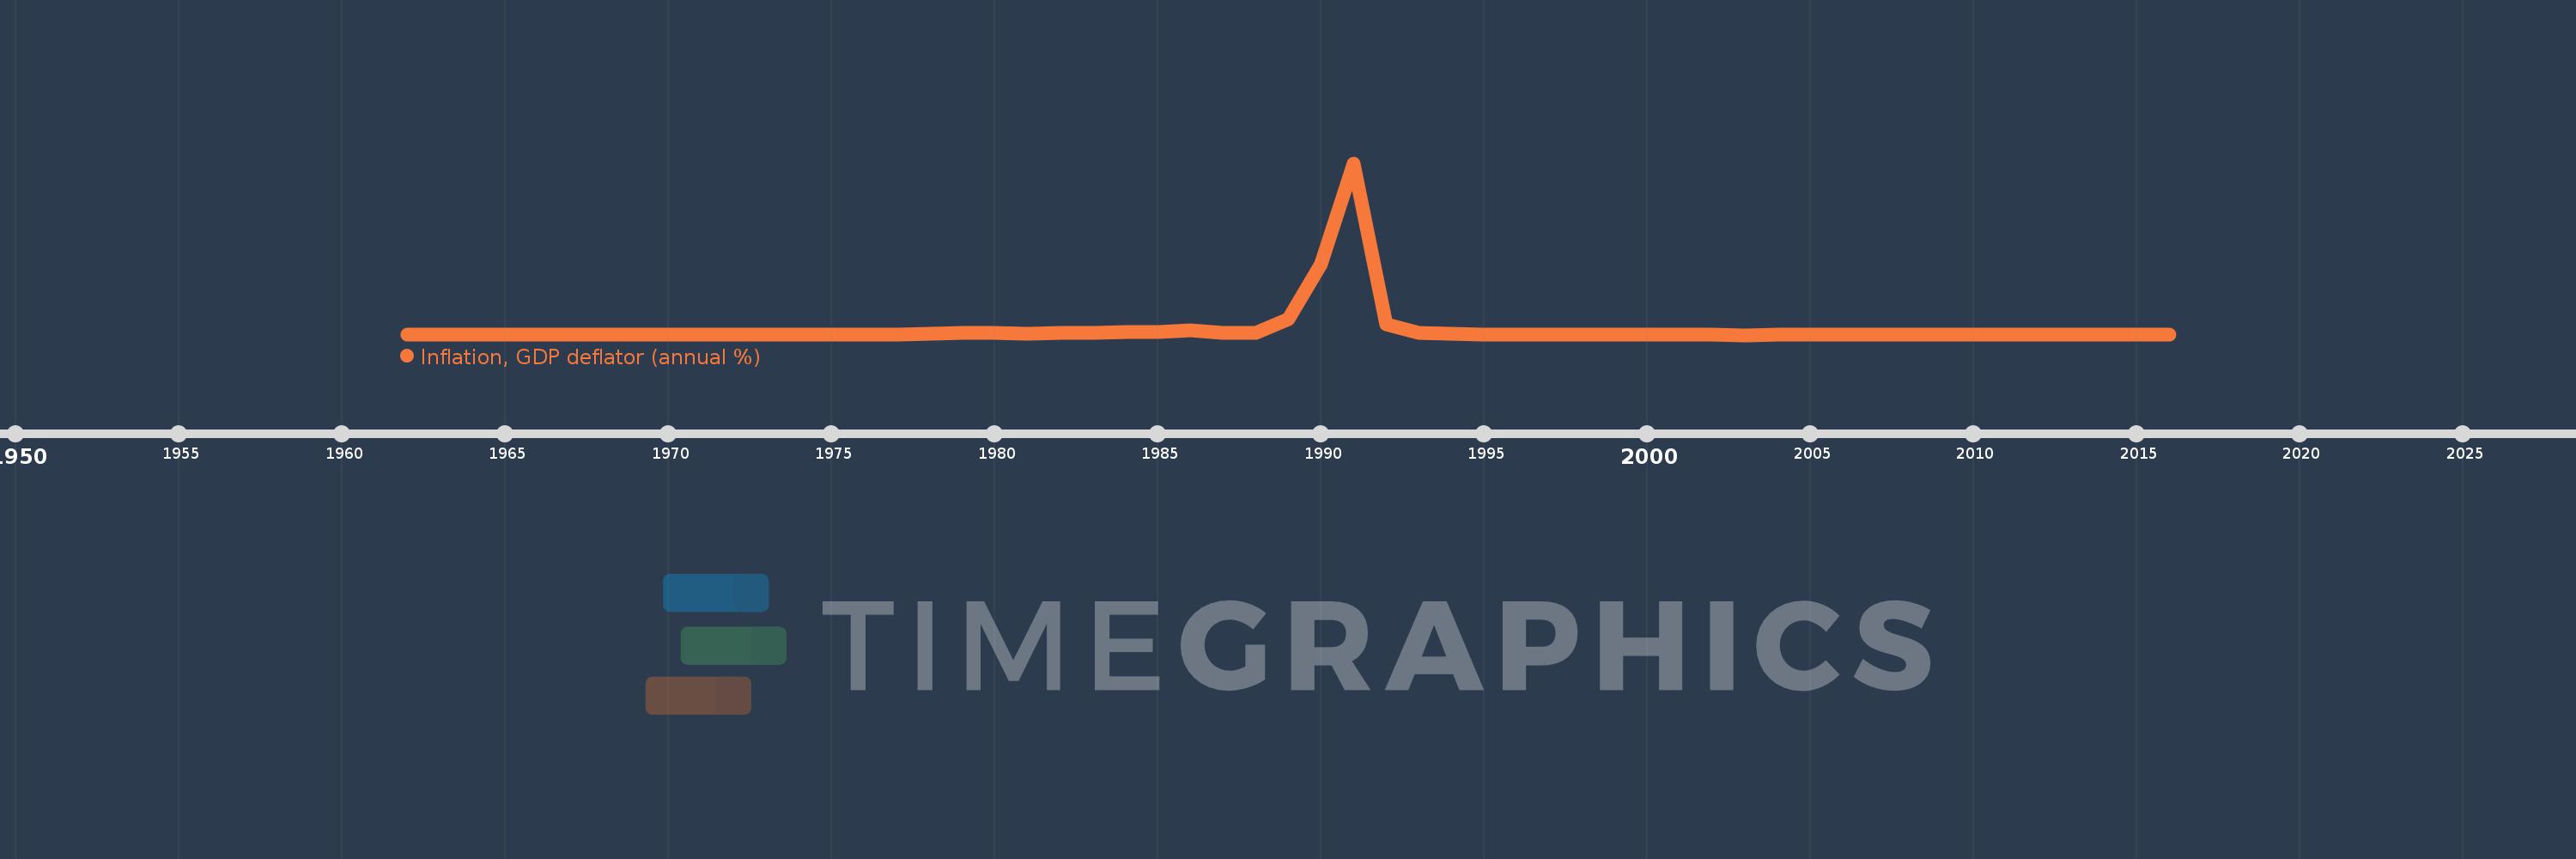
Inflation, GDP deflator (annual %)
2016,2015,2014,2013,2012,2011,2010,2009,2008,2007,2006,2005,2004,2003,2002,2001,2000,1999,1998,1997,1996,1995,1994,1993,1992,1991,1990,1989,1988,1987,1986,1985,1984,1983,1982,1981,1980,1979,1978,1977,1976,1975,1974,1973,1972,1971,1970,1969,1968,1967,1966,1965,1964,1963,1962
Queste statistiche in altri paesi:
AfghanistanAlbaniaAlgeriaAndorraAngolaAntigua and BarbudaArab WorldArgentinaArmeniaArubaAustraliaAustriaAzerbaijanBahamas, TheBahrainBangladeshBarbadosBelarusBelgiumBelizeBeninBermudaBhutanBoliviaBosnia and HerzegovinaBotswanaBrazilBrunei DarussalamBulgariaBurkina FasoBurundiCabo VerdeCambodiaCameroonCanadaCaribbean small statesCayman IslandsCentral African RepublicCentral Europe and the BalticsChadChannel IslandsChileChinaColombiaComorosCongo, Dem. Rep.Congo, Rep.Costa RicaCote d'IvoireCroatiaCubaCyprusCzech RepublicDenmarkDjiboutiDominicaDominican RepublicEarly-demographic dividendEast Asia & PacificEast Asia & Pacific (excluding high income)East Asia & Pacific (IDA & IBRD countries)EcuadorEgypt, Arab Rep.El SalvadorEquatorial GuineaEritreaEstoniaEthiopiaEuro areaEurope & Central AsiaEurope & Central Asia (excluding high income)Europe & Central Asia (IDA & IBRD countries)European UnionFijiFinlandFragile and conflict affected situationsFranceFrench PolynesiaGabonGambia, TheGeorgiaGermanyGhanaGreeceGreenlandGrenadaGuatemalaGuineaGuinea-BissauGuyanaHaitiHeavily indebted poor countries (HIPC)High incomeHondurasHong Kong SAR, ChinaHungaryIBRD onlyIcelandIDA & IBRD totalIDA blendIDA onlyIDA totalIndiaIndonesiaIran, Islamic Rep.IraqIrelandIsle of ManIsraelItalyJamaicaJapanJordanKazakhstanKenyaKiribatiKorea, Rep.KosovoKuwaitKyrgyz RepublicLao PDRLate-demographic dividendLatin America & Caribbean Latin America & Caribbean (excluding high income)Latin America & the Caribbean (IDA & IBRD countries)LatviaLeast developed countries: UN classificationLebanonLesothoLiberiaLibyaLiechtensteinLithuaniaLow & middle incomeLow incomeLower middle incomeLuxembourgMacao SAR, ChinaMacedonia, FYRMadagascarMalawiMalaysiaMaldivesMaliMaltaMarshall IslandsMauritaniaMauritiusMexicoMicronesia, Fed. Sts.Middle East & North AfricaMiddle East & North Africa (excluding high income)Middle East & North Africa (IDA & IBRD countries)Middle incomeMoldovaMonacoMongoliaMontenegroMoroccoMozambiqueMyanmarNamibiaNauruNepalNetherlandsNew CaledoniaNew ZealandNicaraguaNigerNigeriaNorth AmericaNorwayOECD membersOmanOther small statesPacific island small statesPakistanPalauPanamaPapua New GuineaParaguayPeruPhilippinesPolandPortugalPost-demographic dividendPre-demographic dividendPuerto RicoQatarRomaniaRussian FederationRwandaSamoaSan MarinoSao Tome and PrincipeSaudi ArabiaSenegalSerbiaSeychellesSierra LeoneSingaporeSlovak RepublicSloveniaSmall statesSolomon IslandsSomaliaSouth AfricaSouth AsiaSouth Asia (IDA & IBRD)South SudanSpainSri LankaSt. Kitts and NevisSt. LuciaSt. Vincent and the GrenadinesSub-Saharan Africa Sub-Saharan Africa (excluding high income)Sub-Saharan Africa (IDA & IBRD countries)SudanSurinameSwazilandSwedenSwitzerlandSyrian Arab RepublicTajikistanTanzaniaThailandTimor-LesteTogoTongaTrinidad and TobagoTunisiaTurkeyTurkmenistanTuvaluUgandaUkraineUnited Arab EmiratesUnited KingdomUnited StatesUpper middle incomeUruguayUzbekistanVanuatuVenezuela, RBVietnamVirgin Islands (U.S.)West Bank and GazaWorldYemen, Rep.ZambiaZimbabwe Linea del tempo:
Questa scala temporale mostra un grafico dal 1962 anno al 2016 anno. Peru. I dati fino ad 1961 anno non disponibili. Il numero di osservazioni attuali secondo i date: 55.
La fonte (nome):
Indicatori dello sviluppo mondiale
La fonte (organizzazione):
World Bank national accounts data, and OECD National Accounts data files.
Categorie:
Economy & Growth
sono stati aggiornati
23 apr 2017 anni
Indicatori delle variazioni dei valori per anni
Minima:
0.109
1 gen 2003 anni
Massimo:
6.261 Mille.
1 gen 1991 anni
Alla data di osservazione
Valore
Variazione assoluta
La variazione rispetto al valore precedente
1 gen 1962 anni
3.103
+3.103
0.0%
1 gen 1963 anni
3.013
-0.09
-2.92%
1 gen 1964 anni
5.014
+2.001
66.41%
1 gen 1965 anni
13.558
+8.544
170.41%
1 gen 1966 anni
12.278
-1.28
-9.44%
1 gen 1967 anni
9.317
-2.961
-24.12%
1 gen 1968 anni
10.115
+0.798
8.57%
1 gen 1969 anni
18.296
+8.181
80.88%
1 gen 1970 anni
8.138
-10.157
-55.52%
1 gen 1971 anni
11.981
+3.843
47.22%
1 gen 1972 anni
6.64
-5.341
-44.58%
1 gen 1973 anni
7.129
+0.489
7.37%
1 gen 1974 anni
12.576
+5.446
76.39%
1 gen 1975 anni
15.233
+2.658
21.14%
1 gen 1976 anni
22.192
+6.958
45.68%
1 gen 1977 anni
29.713
+7.521
33.89%
1 gen 1978 anni
35.741
+6.028
20.29%
1 gen 1979 anni
63.738
+27.997
78.33%
1 gen 1980 anni
76.35
+12.612
19.79%
1 gen 1981 anni
37.93
-38.42
-50.32%
1 gen 1982 anni
65.331
+27.401
72.24%
1 gen 1983 anni
66.663
+1.333
2.04%
1 gen 1984 anni
107.397
+40.734
61.1%
1 gen 1985 anni
108.478
+1.081
1.01%
1 gen 1986 anni
165.735
+57.257
52.78%
1 gen 1987 anni
68.364
-97.371
-58.75%
1 gen 1988 anni
85.65
+17.286
25.29%
1 gen 1989 anni
586.279
+500.629
584.51%
1 gen 1990 anni
2.572 Mille.
+1.986 Mille.
338.75%
1 gen 1991 anni
6.261 Mille.
+3.689 Mille.
143.41%
1 gen 1992 anni
382.643
-5.879 Mille.
-93.89%
1 gen 1993 anni
68.452
-314.191
-82.11%
1 gen 1994 anni
47.048
-21.405
-31.27%
1 gen 1995 anni
25.513
-21.534
-45.77%
1 gen 1996 anni
13.579
-11.935
-46.78%
1 gen 1997 anni
9.688
-3.891
-28.66%
1 gen 1998 anni
7.283
-2.405
-24.82%
1 gen 1999 anni
5.371
-1.912
-26.25%
1 gen 2000 anni
2.935
-2.437
-45.36%
1 gen 2001 anni
3.525
+0.59
20.11%
1 gen 2002 anni
0.455
-3.069
-87.08%
1 gen 2003 anni
0.109
-0.346
-76.05%
1 gen 2004 anni
1.804
+1.695
1.55 Mille.%
1 gen 2005 anni
6.279
+4.475
248.12%
1 gen 2006 anni
3.504
-2.775
-44.2%
1 gen 2007 anni
7.656
+4.153
118.52%
1 gen 2008 anni
1.491
-6.166
-80.53%
1 gen 2009 anni
1.103
-0.387
-25.99%
1 gen 2010 anni
2.064
+0.96
87.05%
1 gen 2011 anni
5.711
+3.647
176.72%
1 gen 2012 anni
6.746
+1.035
18.12%
1 gen 2013 anni
1.203
-5.543
-82.17%
1 gen 2014 anni
1.078
-0.124
-10.32%
1 gen 2015 anni
2.572
+1.493
138.46%
1 gen 2016 anni
2.238
-0.334
-12.97%
Classificazione dei paesi secondo i statistiche attuali per anni


Commenti: