29
/it/
it
AIzaSyAYiBZKx7MnpbEhh9jyipgxe19OcubqV5w
April 1, 2024
272398
Uganda
UGA
true
2
1
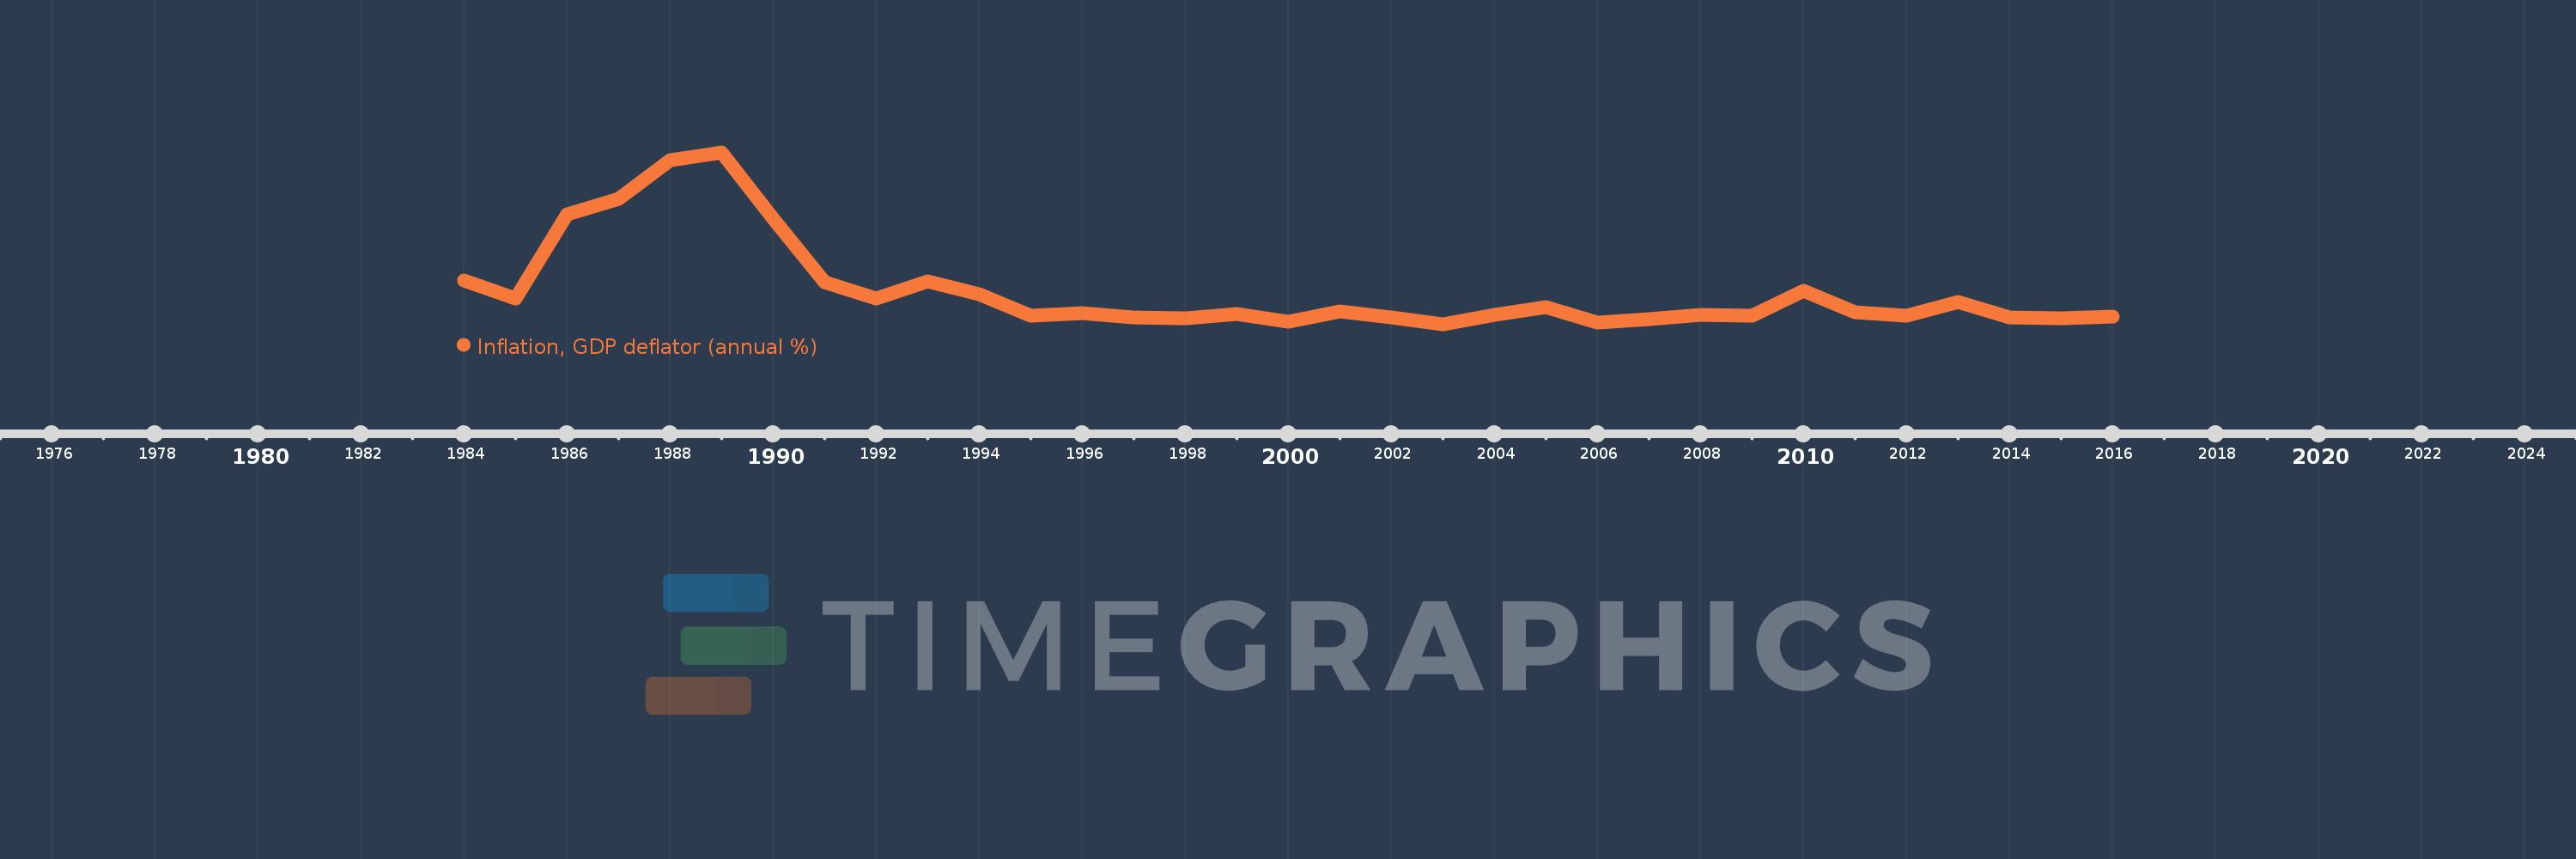
Inflation, GDP deflator (annual %)
2016,2015,2014,2013,2012,2011,2010,2009,2008,2007,2006,2005,2004,2003,2002,2001,2000,1999,1998,1997,1996,1995,1994,1993,1992,1991,1990,1989,1988,1987,1986,1985,1984
Queste statistiche in altri paesi:
AfghanistanAlbaniaAlgeriaAndorraAngolaAntigua and BarbudaArab WorldArgentinaArmeniaArubaAustraliaAustriaAzerbaijanBahamas, TheBahrainBangladeshBarbadosBelarusBelgiumBelizeBeninBermudaBhutanBoliviaBosnia and HerzegovinaBotswanaBrazilBrunei DarussalamBulgariaBurkina FasoBurundiCabo VerdeCambodiaCameroonCanadaCaribbean small statesCayman IslandsCentral African RepublicCentral Europe and the BalticsChadChannel IslandsChileChinaColombiaComorosCongo, Dem. Rep.Congo, Rep.Costa RicaCote d'IvoireCroatiaCubaCyprusCzech RepublicDenmarkDjiboutiDominicaDominican RepublicEarly-demographic dividendEast Asia & PacificEast Asia & Pacific (excluding high income)East Asia & Pacific (IDA & IBRD countries)EcuadorEgypt, Arab Rep.El SalvadorEquatorial GuineaEritreaEstoniaEthiopiaEuro areaEurope & Central AsiaEurope & Central Asia (excluding high income)Europe & Central Asia (IDA & IBRD countries)European UnionFijiFinlandFragile and conflict affected situationsFranceFrench PolynesiaGabonGambia, TheGeorgiaGermanyGhanaGreeceGreenlandGrenadaGuatemalaGuineaGuinea-BissauGuyanaHaitiHeavily indebted poor countries (HIPC)High incomeHondurasHong Kong SAR, ChinaHungaryIBRD onlyIcelandIDA & IBRD totalIDA blendIDA onlyIDA totalIndiaIndonesiaIran, Islamic Rep.IraqIrelandIsle of ManIsraelItalyJamaicaJapanJordanKazakhstanKenyaKiribatiKorea, Rep.KosovoKuwaitKyrgyz RepublicLao PDRLate-demographic dividendLatin America & Caribbean Latin America & Caribbean (excluding high income)Latin America & the Caribbean (IDA & IBRD countries)LatviaLeast developed countries: UN classificationLebanonLesothoLiberiaLibyaLiechtensteinLithuaniaLow & middle incomeLow incomeLower middle incomeLuxembourgMacao SAR, ChinaMacedonia, FYRMadagascarMalawiMalaysiaMaldivesMaliMaltaMarshall IslandsMauritaniaMauritiusMexicoMicronesia, Fed. Sts.Middle East & North AfricaMiddle East & North Africa (excluding high income)Middle East & North Africa (IDA & IBRD countries)Middle incomeMoldovaMonacoMongoliaMontenegroMoroccoMozambiqueMyanmarNamibiaNauruNepalNetherlandsNew CaledoniaNew ZealandNicaraguaNigerNigeriaNorth AmericaNorwayOECD membersOmanOther small statesPacific island small statesPakistanPalauPanamaPapua New GuineaParaguayPeruPhilippinesPolandPortugalPost-demographic dividendPre-demographic dividendPuerto RicoQatarRomaniaRussian FederationRwandaSamoaSan MarinoSao Tome and PrincipeSaudi ArabiaSenegalSerbiaSeychellesSierra LeoneSingaporeSlovak RepublicSloveniaSmall statesSolomon IslandsSomaliaSouth AfricaSouth AsiaSouth Asia (IDA & IBRD)South SudanSpainSri LankaSt. Kitts and NevisSt. LuciaSt. Vincent and the GrenadinesSub-Saharan Africa Sub-Saharan Africa (excluding high income)Sub-Saharan Africa (IDA & IBRD countries)SudanSurinameSwazilandSwedenSwitzerlandSyrian Arab RepublicTajikistanTanzaniaThailandTimor-LesteTogoTongaTrinidad and TobagoTunisiaTurkeyTurkmenistanTuvaluUgandaUkraineUnited Arab EmiratesUnited KingdomUnited StatesUpper middle incomeUruguayUzbekistanVanuatuVenezuela, RBVietnamVirgin Islands (U.S.)West Bank and GazaWorldYemen, Rep.ZambiaZimbabwe Linea del tempo:
Questa scala temporale mostra un grafico dal 1984 anno al 2016 anno. Uganda. I dati fino ad 1983 anno non disponibili. Il numero di osservazioni attuali secondo i date: 33.
La fonte (nome):
Indicatori dello sviluppo mondiale
La fonte (organizzazione):
World Bank national accounts data, and OECD National Accounts data files.
Categorie:
Economy & Growth
sono stati aggiornati
23 apr 2017 anni
Indicatori delle variazioni dei valori per anni
Minima:
-3.17
1 gen 2003 anni
Massimo:
189.975
1 gen 1989 anni
Alla data di osservazione
Valore
Variazione assoluta
La variazione rispetto al valore precedente
1 gen 1984 anni
45.944
+45.944
0.0%
1 gen 1985 anni
25.277
-20.668
-44.98%
1 gen 1986 anni
120.336
+95.059
376.07%
1 gen 1987 anni
137.281
+16.945
14.08%
1 gen 1988 anni
180.988
+43.707
31.84%
1 gen 1989 anni
189.975
+8.987
4.97%
1 gen 1990 anni
115.447
-74.528
-39.23%
1 gen 1991 anni
44.38
-71.067
-61.56%
1 gen 1992 anni
26.019
-18.361
-41.37%
1 gen 1993 anni
45.068
+19.049
73.21%
1 gen 1994 anni
30.137
-14.931
-33.13%
1 gen 1995 anni
6.848
-23.288
-77.28%
1 gen 1996 anni
9.376
+2.528
36.91%
1 gen 1997 anni
4.572
-4.804
-51.23%
1 gen 1998 anni
3.095
-1.477
-32.31%
1 gen 1999 anni
8.786
+5.69
183.84%
1 gen 2000 anni
-0.113
-8.899
-101.29%
1 gen 2001 anni
11.117
+11.23
-9.93 Mille.%
1 gen 2002 anni
4.534
-6.583
-59.21%
1 gen 2003 anni
-3.17
-7.704
-169.9%
1 gen 2004 anni
7.807
+10.976
-346.3%
1 gen 2005 anni
15.588
+7.781
99.67%
1 gen 2006 anni
-1.741
-17.329
-111.17%
1 gen 2007 anni
2.406
+4.147
-238.16%
1 gen 2008 anni
7.321
+4.916
204.34%
1 gen 2009 anni
6.364
-0.957
-13.07%
1 gen 2010 anni
34.007
+27.643
434.35%
1 gen 2011 anni
10.579
-23.429
-68.89%
1 gen 2012 anni
6.156
-4.423
-41.81%
1 gen 2013 anni
21.714
+15.558
252.74%
1 gen 2014 anni
4.032
-17.683
-81.43%
1 gen 2015 anni
3.44
-0.591
-14.67%
1 gen 2016 anni
5.08
+1.64
47.66%
Classificazione dei paesi secondo i statistiche attuali per anni


Commenti: