29
/it/
it
AIzaSyAYiBZKx7MnpbEhh9jyipgxe19OcubqV5w
April 1, 2024
285010
Yemen, Rep.
YEM
true
2
1
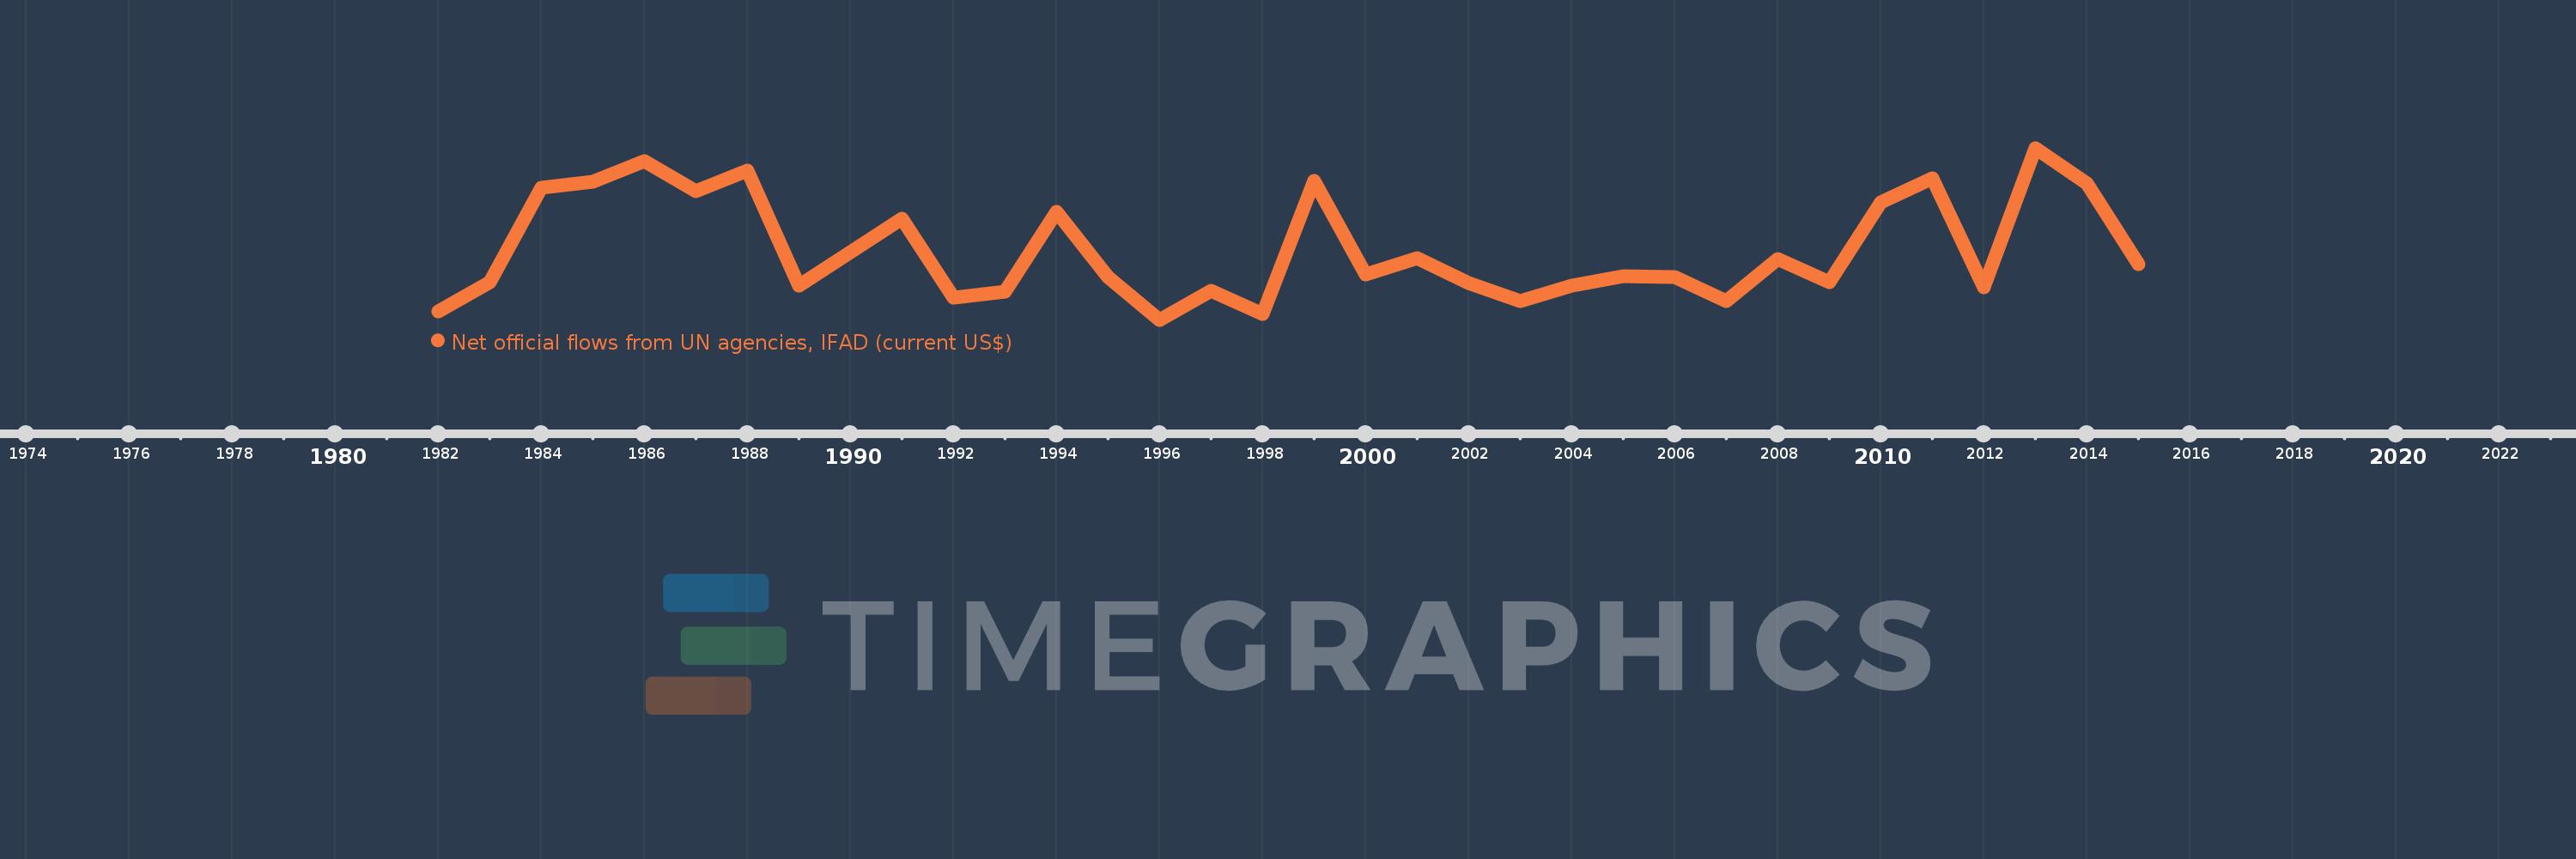
Net official flows from UN agencies, IFAD (current US$)
2015,2014,2013,2012,2011,2010,2009,2008,2007,2006,2005,2004,2003,2002,2001,2000,1999,1998,1997,1996,1995,1994,1993,1992,1991,1990,1989,1988,1987,1986,1985,1984,1983,1982
Queste statistiche in altri paesi:
Linea del tempo:
Questa scala temporale mostra un grafico dal 1982 anno al 2015 anno. Yemen, Rep.. I dati fino ad 1981 anno non disponibili. Il numero di osservazioni attuali secondo i date: 34.
La fonte (nome):
Indicatori dello sviluppo mondiale
La fonte (organizzazione):
Development Assistance Committee of the Organisation for Economic Co-operation and Development, Geographical Distribution of Financial Flows to Developing Countries, Development Co-operation Report, and International Development Statistics database. Data are available online at: www.oecd.org/dac/stats/idsonline.
Categorie:
Aid Effectiveness
sono stati aggiornati
23 apr 2017 anni
Indicatori delle variazioni dei valori per anni
Minima:
-190.0 Mille.
1 gen 1996 anni
Massimo:
11.32 Mln
1 gen 2013 anni
Alla data di osservazione
Valore
Variazione assoluta
La variazione rispetto al valore precedente
1 gen 1982 anni
380.0 Mille.
+380.0 Mille.
0.0%
1 gen 1983 anni
2.33 Mln
+1.95 Mln
513.16%
1 gen 1984 anni
8.66 Mln
+6.33 Mln
271.67%
1 gen 1985 anni
9.05 Mln
+390.0 Mille.
4.5%
1 gen 1986 anni
10.43 Mln
+1.38 Mln
15.25%
1 gen 1987 anni
8.44 Mln
-1.99 Mln
-19.08%
1 gen 1988 anni
9.78 Mln
+1.34 Mln
15.88%
1 gen 1989 anni
2.08 Mln
-7.7 Mln
-78.73%
1 gen 1990 anni
4.35 Mln
+2.27 Mln
109.13%
1 gen 1991 anni
6.57 Mln
+2.22 Mln
51.03%
1 gen 1992 anni
1.27 Mln
-5.3 Mln
-80.67%
1 gen 1993 anni
1.7 Mln
+430.0 Mille.
33.86%
1 gen 1994 anni
7.02 Mln
+5.32 Mln
312.94%
1 gen 1995 anni
2.65 Mln
-4.37 Mln
-62.25%
1 gen 1996 anni
-190.0 Mille.
-2.84 Mln
-107.17%
1 gen 1997 anni
1.73 Mln
+1.92 Mln
-1.01 Mille.%
1 gen 1998 anni
190.0 Mille.
-1.54 Mln
-89.02%
1 gen 1999 anni
9.1 Mln
+8.91 Mln
4.69 Mille.%
1 gen 2000 anni
2.86 Mln
-6.24 Mln
-68.57%
1 gen 2001 anni
3.91 Mln
+1.05 Mln
36.71%
1 gen 2002 anni
2.29 Mln
-1.62 Mln
-41.43%
1 gen 2003 anni
1.05 Mln
-1.24 Mln
-54.15%
1 gen 2004 anni
2.07 Mln
+1.02 Mln
97.14%
1 gen 2005 anni
2.73 Mln
+660.0 Mille.
31.88%
1 gen 2006 anni
2.66 Mln
-70.0 Mille.
-2.56%
1 gen 2007 anni
1.07 Mln
-1.59 Mln
-59.77%
1 gen 2008 anni
3.88 Mln
+2.81 Mln
262.62%
1 gen 2009 anni
2.31 Mln
-1.57 Mln
-40.46%
1 gen 2010 anni
7.68 Mln
+5.37 Mln
232.47%
1 gen 2011 anni
9.27 Mln
+1.59 Mln
20.7%
1 gen 2012 anni
1.98 Mln
-7.29 Mln
-78.64%
1 gen 2013 anni
11.32 Mln
+9.34 Mln
471.72%
1 gen 2014 anni
8.95 Mln
-2.37 Mln
-20.94%
1 gen 2015 anni
3.56 Mln
-5.39 Mln
-60.22%
Classificazione dei paesi secondo i statistiche attuali per anni


Commenti: