30
/it/
AIzaSyAYiBZKx7MnpbEhh9jyipgxe19OcubqV5w
April 1, 2024
128626
Eritrea
ERI
true
2
1
Net official flows from UN agencies, IFAD (current US$)
2015,2014,2013,2012,2011,2010,2009,2008,2007,2006,2005,2004,2003,2002,2001,2000,1999,1998,1996
Download
Biblioteca di statistiche globali →Eritrea →

Net official flows from UN agencies, IFAD (current US$)

Queste statistiche in altri paesi:

AfghanistanAlbaniaAlgeriaAngolaArab WorldArgentinaArmeniaAzerbaijanBangladeshBelizeBeninBhutanBoliviaBosnia and HerzegovinaBotswanaBrazilBurkina FasoBurundiCabo VerdeCambodiaCameroonCaribbean small statesCentral African RepublicCentral Europe and the BalticsChadChileChinaColombiaComorosCongo, Dem. Rep.Congo, Rep.Costa RicaCote d'IvoireCubaCyprusDjiboutiDominicaDominican RepublicEast Asia & PacificEast Asia & Pacific (excluding high income)East Asia & Pacific (IDA & IBRD countries)EcuadorEgypt, Arab Rep.El SalvadorEquatorial GuineaEritreaEthiopiaEuro areaEurope & Central AsiaEurope & Central Asia (excluding high income)Europe & Central Asia (IDA & IBRD countries)European UnionFragile and conflict affected situationsGabonGambia, TheGeorgiaGhanaGrenadaGuatemalaGuineaGuinea-BissauGuyanaHaitiHeavily indebted poor countries (HIPC)High incomeHondurasIBRD onlyIDA & IBRD totalIDA blendIDA onlyIDA totalIndiaIndonesiaIraqJamaicaJordanKenyaKorea, Dem. People’s Rep.Kyrgyz RepublicLao PDRLatin America & Caribbean Latin America & Caribbean (excluding high income)Latin America & the Caribbean (IDA & IBRD countries)Least developed countries: UN classificationLebanonLesothoLiberiaLow incomeLower middle incomeMacao SAR, ChinaMacedonia, FYRMadagascarMalawiMaldivesMaliMauritaniaMauritiusMexicoMiddle East & North AfricaMiddle East & North Africa (excluding high income)Middle East & North Africa (IDA & IBRD countries)MoldovaMongoliaMoroccoMozambiqueMyanmarNamibiaNepalNicaraguaNigerNigeriaOECD membersOther small statesPacific island small statesPakistanPanamaPapua New GuineaParaguayPeruPhilippinesRomaniaRwandaSamoaSao Tome and PrincipeSenegalSeychellesSierra LeoneSmall statesSolomon IslandsSomaliaSouth AsiaSouth Asia (IDA & IBRD)South SudanSri LankaSt. LuciaSt. Vincent and the GrenadinesSub-Saharan Africa Sub-Saharan Africa (excluding high income)Sub-Saharan Africa (IDA & IBRD countries)SudanSurinameSwazilandSyrian Arab RepublicTajikistanTanzaniaThailandTimor-LesteTogoTongaTunisiaTurkeyUgandaUpper middle incomeUruguayUzbekistanVenezuela, RBVietnamWest Bank and GazaWorldYemen, Rep.ZambiaZimbabwe

Linea del tempo:

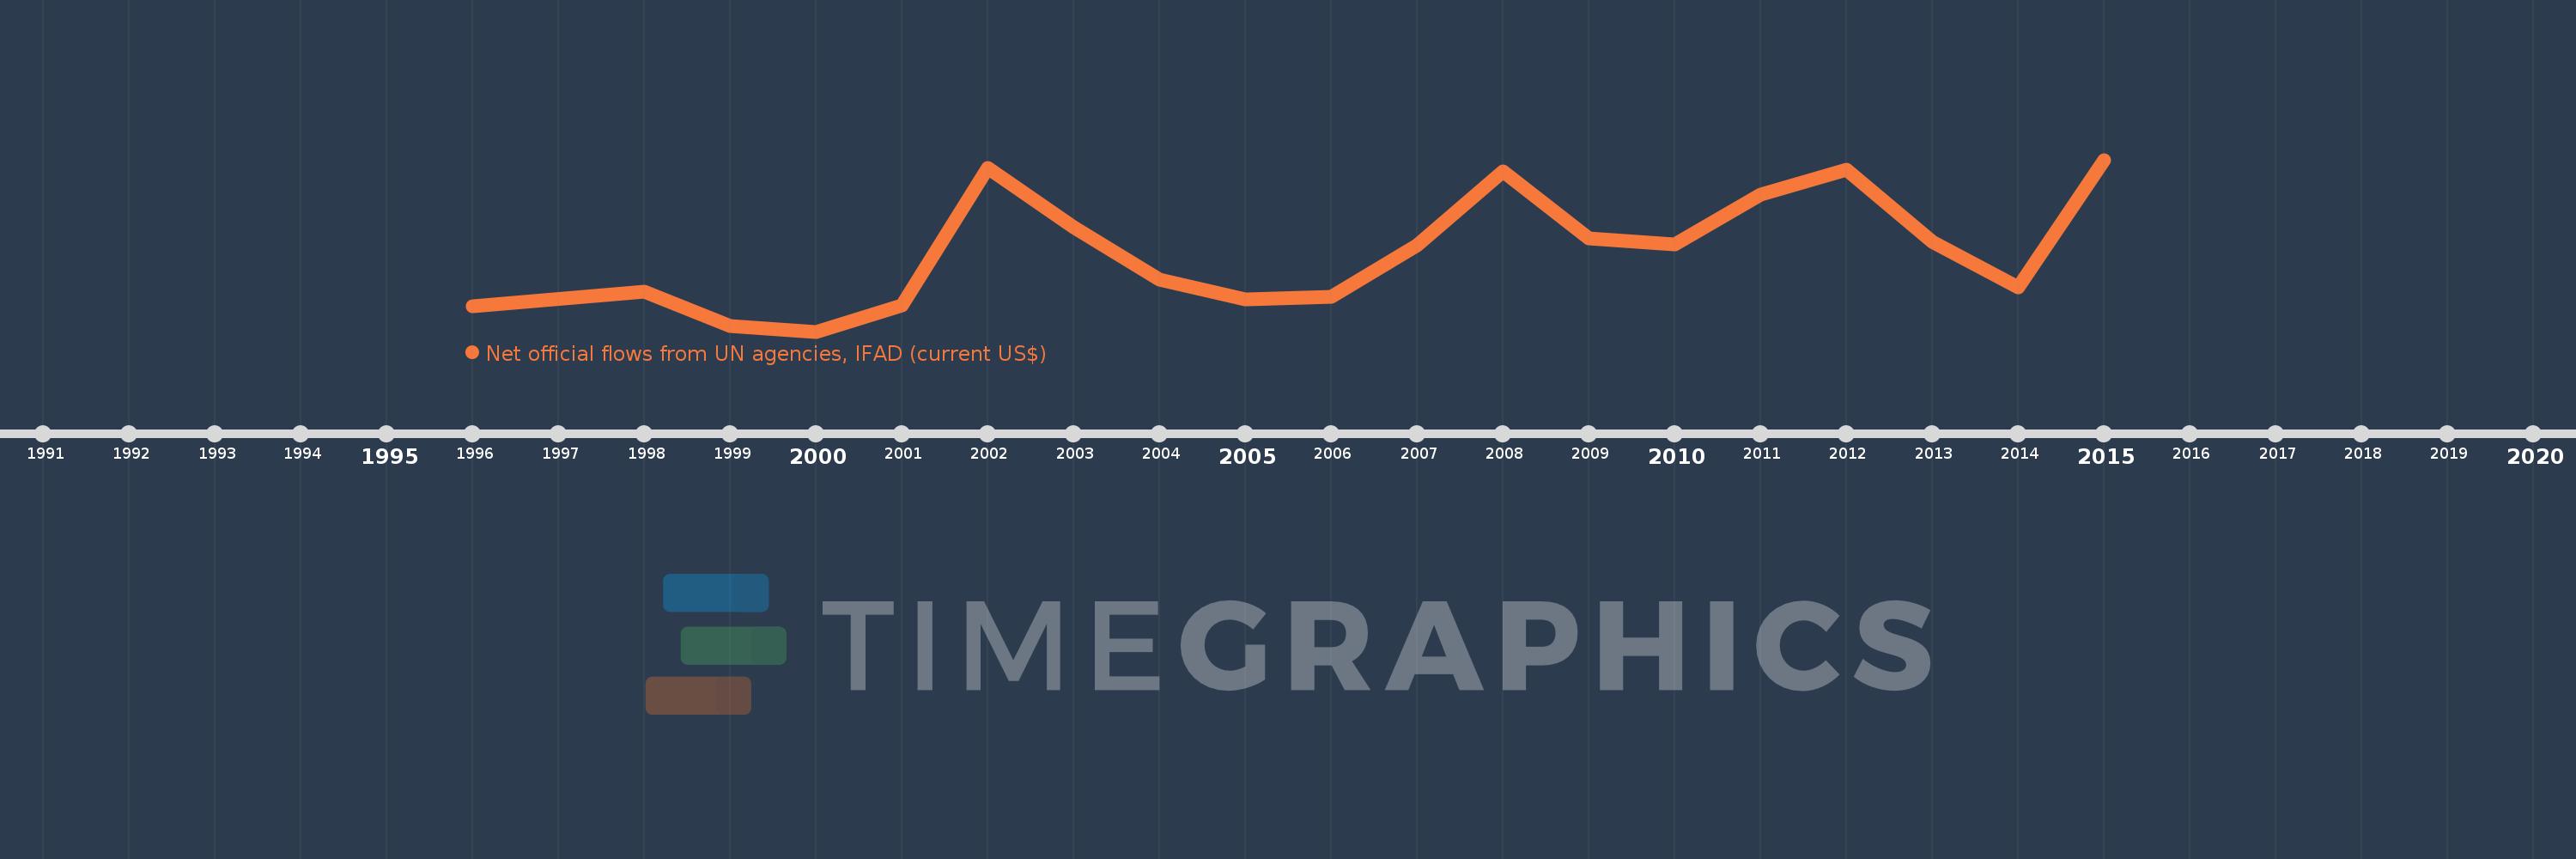
Questa scala temporale mostra un grafico dal 1996 anno al 2015 anno. Eritrea. I dati fino ad 1995 anno non disponibili. Il numero di osservazioni attuali secondo i date: 19.

La fonte (nome):

Indicatori dello sviluppo mondiale

La fonte (organizzazione):

Development Assistance Committee of the Organisation for Economic Co-operation and Development, Geographical Distribution of Financial Flows to Developing Countries, Development Co-operation Report, and International Development Statistics database. Data are available online at: www.oecd.org/dac/stats/idsonline.

Categorie:

Aid Effectiveness

sono stati aggiornati

23 apr 2017 anni

Indicatori delle variazioni dei valori per anni

In media:
2.193 Mln
Minima:
60.0 Mille.
1 gen 2000 anni
Massimo:
4.65 Mln
1 gen 2015 anni
Alla data di osservazione
Valore
Variazione assoluta
La variazione rispetto al valore precedente
1 gen 1996 anni
730.0 Mille.
+730.0 Mille.
0.0%
1 gen 1998 anni
1.13 Mln
+400.0 Mille.
54.79%
1 gen 1999 anni
210.0 Mille.
-920.0 Mille.
-81.42%
1 gen 2000 anni
60.0 Mille.
-150.0 Mille.
-71.43%
1 gen 2001 anni
770.0 Mille.
+710.0 Mille.
1.18 Mille.%
1 gen 2002 anni
4.43 Mln
+3.66 Mln
475.32%
1 gen 2003 anni
2.85 Mln
-1.58 Mln
-35.67%
1 gen 2004 anni
1.45 Mln
-1.4 Mln
-49.12%
1 gen 2005 anni
930.0 Mille.
-520.0 Mille.
-35.86%
1 gen 2006 anni
990.0 Mille.
+60.0 Mille.
6.45%
1 gen 2007 anni
2.37 Mln
+1.38 Mln
139.39%
1 gen 2008 anni
4.35 Mln
+1.98 Mln
83.54%
1 gen 2009 anni
2.54 Mln
-1.81 Mln
-41.61%
1 gen 2010 anni
2.39 Mln
-150.0 Mille.
-5.91%
1 gen 2011 anni
3.73 Mln
+1.34 Mln
56.07%
1 gen 2012 anni
4.39 Mln
+660.0 Mille.
17.69%
1 gen 2013 anni
2.45 Mln
-1.94 Mln
-44.19%
1 gen 2014 anni
1.25 Mln
-1.2 Mln
-48.98%
1 gen 2015 anni
4.65 Mln
+3.4 Mln
272.0%

Classificazione dei paesi secondo i statistiche attuali per anni