29
/it/
it
AIzaSyAYiBZKx7MnpbEhh9jyipgxe19OcubqV5w
April 1, 2024
165242
Jordan
JOR
true
2
1
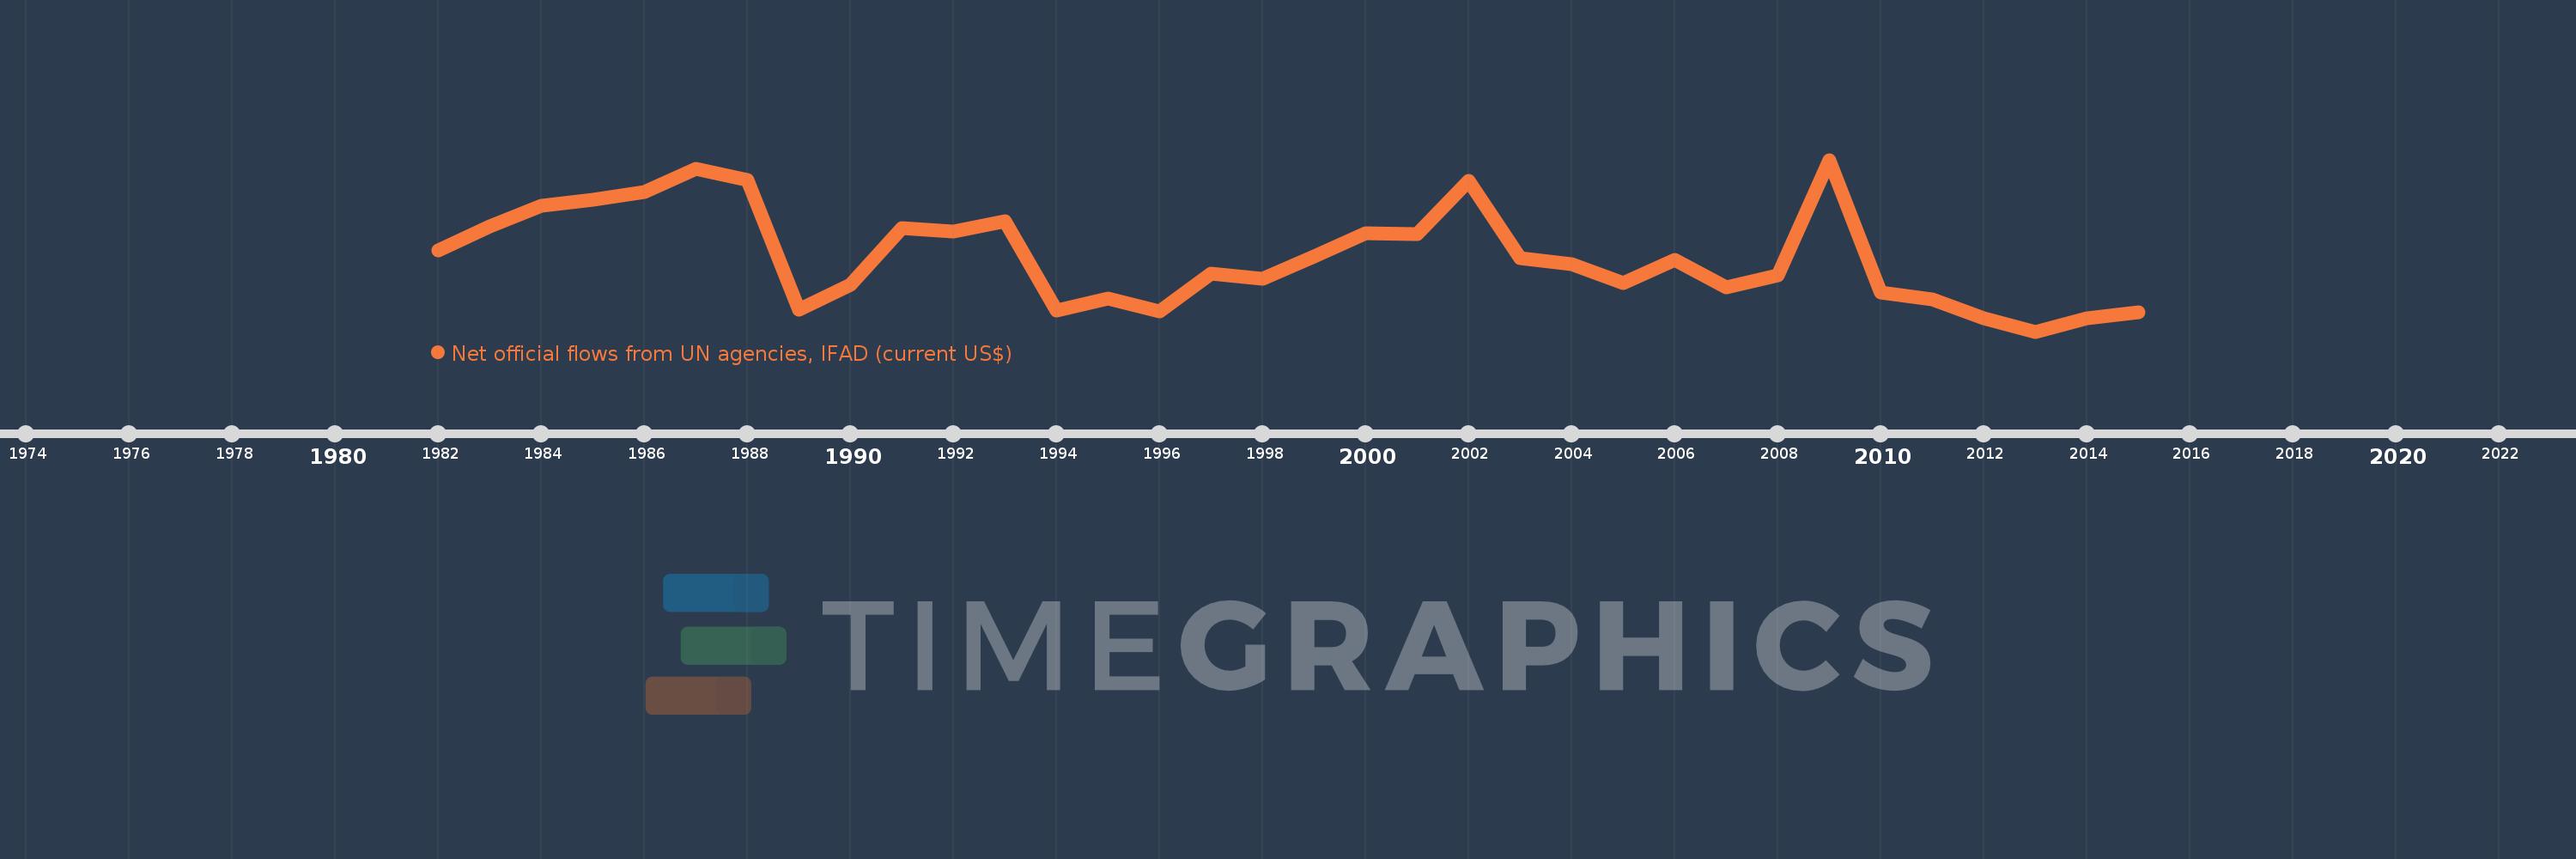
Net official flows from UN agencies, IFAD (current US$)
2015,2014,2013,2012,2011,2010,2009,2008,2007,2006,2005,2004,2003,2002,2001,2000,1999,1998,1997,1996,1995,1994,1993,1992,1991,1990,1989,1988,1987,1986,1985,1984,1983,1982
Queste statistiche in altri paesi:
Linea del tempo:
Questa scala temporale mostra un grafico dal 1982 anno al 2015 anno. Jordan. I dati fino ad 1981 anno non disponibili. Il numero di osservazioni attuali secondo i date: 34.
La fonte (nome):
Indicatori dello sviluppo mondiale
La fonte (organizzazione):
Development Assistance Committee of the Organisation for Economic Co-operation and Development, Geographical Distribution of Financial Flows to Developing Countries, Development Co-operation Report, and International Development Statistics database. Data are available online at: www.oecd.org/dac/stats/idsonline.
Categorie:
Aid Effectiveness
sono stati aggiornati
23 apr 2017 anni
Indicatori delle variazioni dei valori per anni
Minima:
-2.65 Mln
1 gen 2013 anni
Massimo:
4.16 Mln
1 gen 2009 anni
Alla data di osservazione
Valore
Variazione assoluta
La variazione rispetto al valore precedente
1 gen 1982 anni
580.0 Mille.
+580.0 Mille.
0.0%
1 gen 1983 anni
1.52 Mln
+940.0 Mille.
162.07%
1 gen 1984 anni
2.34 Mln
+820.0 Mille.
53.95%
1 gen 1985 anni
2.58 Mln
+240.0 Mille.
10.26%
1 gen 1986 anni
2.9 Mln
+320.0 Mille.
12.4%
1 gen 1987 anni
3.79 Mln
+890.0 Mille.
30.69%
1 gen 1988 anni
3.35 Mln
-440.0 Mille.
-11.61%
1 gen 1989 anni
-1.79 Mln
-5.14 Mln
-153.43%
1 gen 1990 anni
-790.0 Mille.
+1000.0 Mille.
-55.87%
1 gen 1991 anni
1.45 Mln
+2.24 Mln
-283.54%
1 gen 1992 anni
1.3 Mln
-150.0 Mille.
-10.34%
1 gen 1993 anni
1.71 Mln
+410.0 Mille.
31.54%
1 gen 1994 anni
-1.82 Mln
-3.53 Mln
-206.43%
1 gen 1995 anni
-1.34 Mln
+480.0 Mille.
-26.37%
1 gen 1996 anni
-1.85 Mln
-510.0 Mille.
38.06%
1 gen 1997 anni
-350.0 Mille.
+1.5 Mln
-81.08%
1 gen 1998 anni
-560.0 Mille.
-210.0 Mille.
60.0%
1 gen 1999 anni
340.0 Mille.
+900.0 Mille.
-160.71%
1 gen 2000 anni
1.26 Mln
+920.0 Mille.
270.59%
1 gen 2001 anni
1.2 Mln
-60.0 Mille.
-4.76%
1 gen 2002 anni
3.32 Mln
+2.12 Mln
176.67%
1 gen 2003 anni
270.0 Mille.
-3.05 Mln
-91.87%
1 gen 2004 anni
30.0 Mille.
-240.0 Mille.
-88.89%
1 gen 2005 anni
-740.0 Mille.
-770.0 Mille.
-2.57 Mille.%
1 gen 2006 anni
180.0 Mille.
+920.0 Mille.
-124.32%
1 gen 2007 anni
-880.0 Mille.
-1.06 Mln
-588.89%
1 gen 2008 anni
-410.0 Mille.
+470.0 Mille.
-53.41%
1 gen 2009 anni
4.16 Mln
+4.57 Mln
-1.11 Mille.%
1 gen 2010 anni
-1.1 Mln
-5.26 Mln
-126.44%
1 gen 2011 anni
-1.38 Mln
-280.0 Mille.
25.45%
1 gen 2012 anni
-2.12 Mln
-740.0 Mille.
53.62%
1 gen 2013 anni
-2.65 Mln
-530.0 Mille.
25.0%
1 gen 2014 anni
-2.13 Mln
+520.0 Mille.
-19.62%
1 gen 2015 anni
-1.9 Mln
+230.0 Mille.
-10.8%
Classificazione dei paesi secondo i statistiche attuali per anni


Commenti: