29
/it/
it
AIzaSyAYiBZKx7MnpbEhh9jyipgxe19OcubqV5w
April 1, 2024
280955
Venezuela, RB
VEN
true
2
1
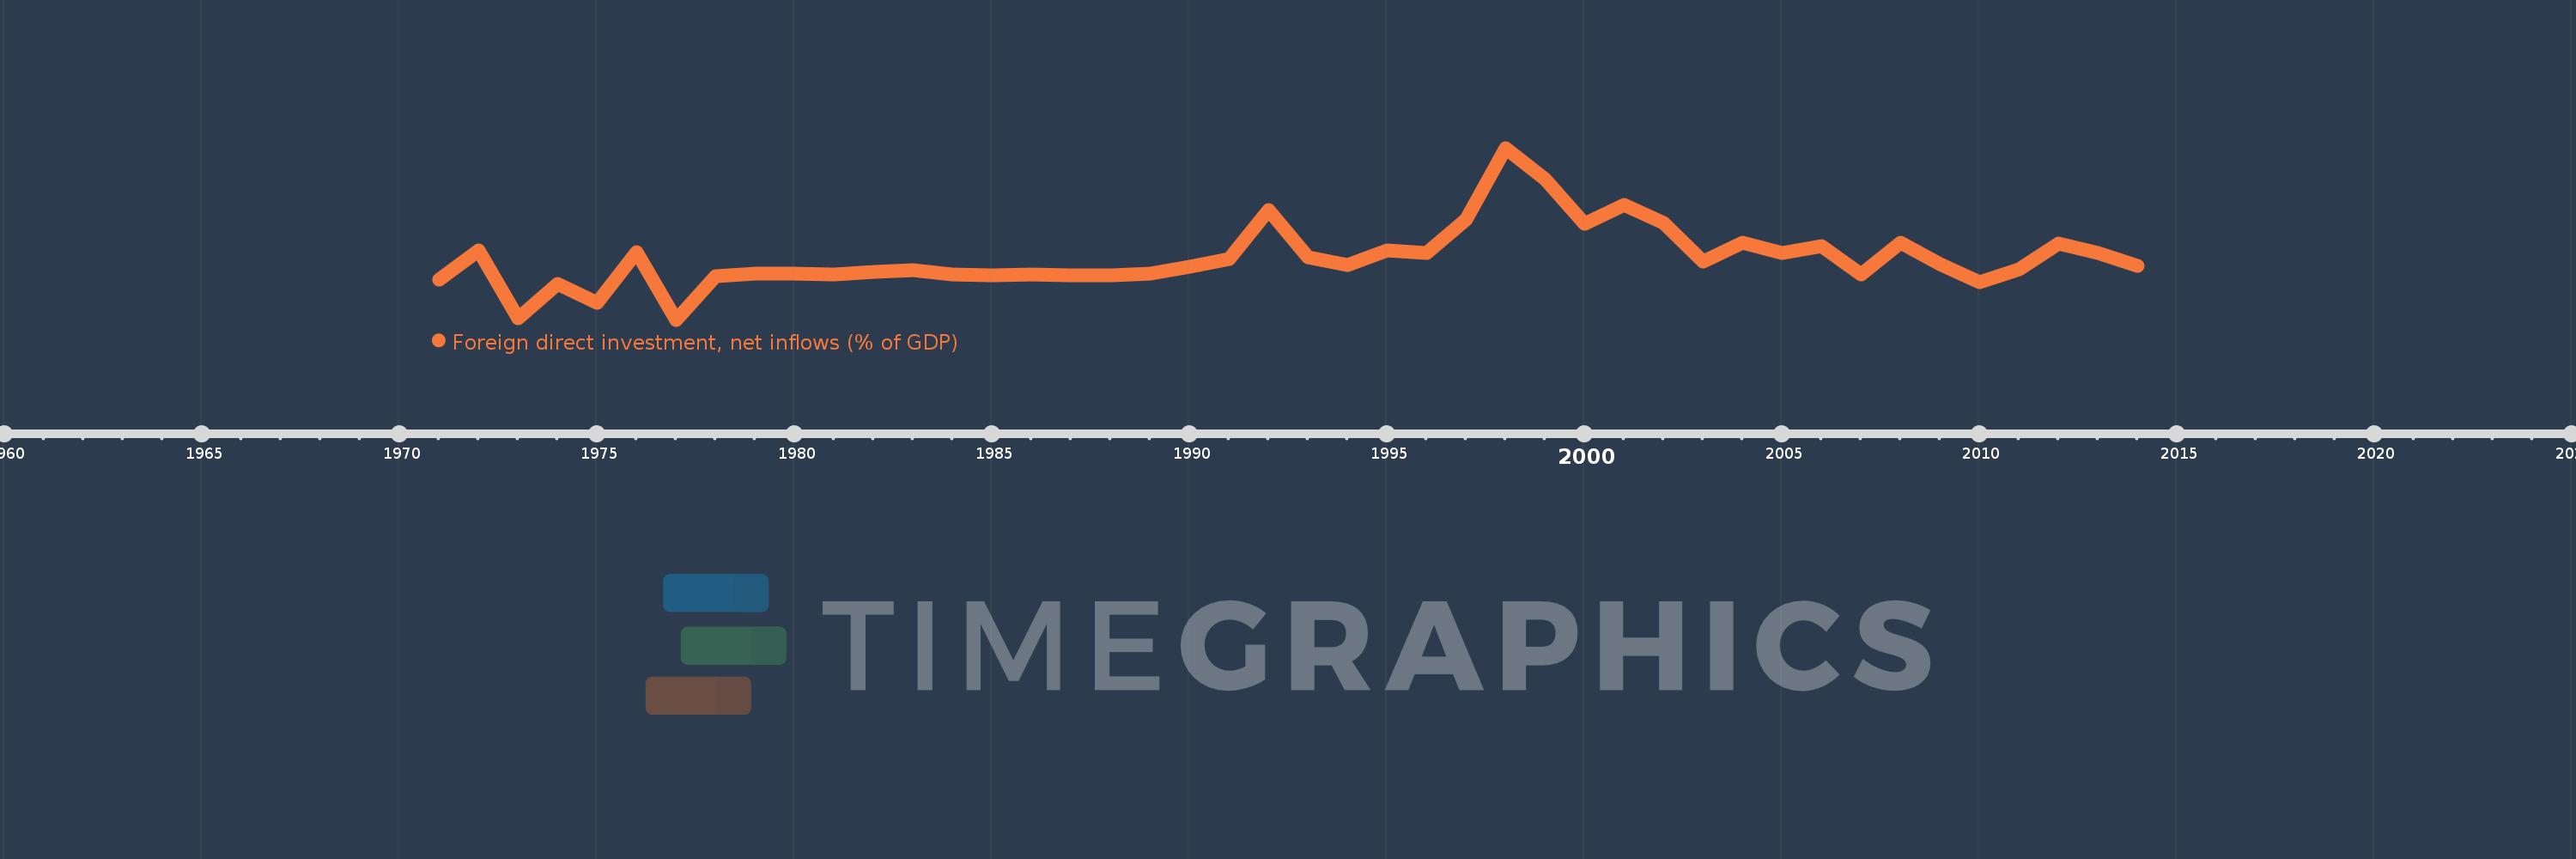
Foreign direct investment, net inflows (% of GDP)
2014,2013,2012,2011,2010,2009,2008,2007,2006,2005,2004,2003,2002,2001,2000,1999,1998,1997,1996,1995,1994,1993,1992,1991,1990,1989,1988,1987,1986,1985,1984,1983,1982,1981,1980,1979,1978,1977,1976,1975,1974,1973,1972,1971
Queste statistiche in altri paesi:
AfghanistanAlbaniaAlgeriaAngolaAntigua and BarbudaArab WorldArgentinaArmeniaArubaAustraliaAustriaAzerbaijanBahamas, TheBahrainBangladeshBarbadosBelarusBelgiumBelizeBeninBermudaBhutanBoliviaBosnia and HerzegovinaBotswanaBrazilBrunei DarussalamBulgariaBurkina FasoBurundiCabo VerdeCambodiaCameroonCanadaCaribbean small statesCayman IslandsCentral African RepublicCentral Europe and the BalticsChadChileChinaColombiaComorosCongo, Dem. Rep.Congo, Rep.Costa RicaCote d'IvoireCroatiaCyprusCzech RepublicDenmarkDjiboutiDominicaDominican RepublicEarly-demographic dividendEast Asia & PacificEast Asia & Pacific (excluding high income)East Asia & Pacific (IDA & IBRD countries)EcuadorEgypt, Arab Rep.El SalvadorEquatorial GuineaEritreaEstoniaEthiopiaEuro areaEurope & Central AsiaEurope & Central Asia (excluding high income)Europe & Central Asia (IDA & IBRD countries)European UnionFijiFinlandFragile and conflict affected situationsFranceFrench PolynesiaGabonGambia, TheGeorgiaGermanyGhanaGreeceGrenadaGuatemalaGuineaGuinea-BissauGuyanaHaitiHeavily indebted poor countries (HIPC)High incomeHondurasHong Kong SAR, ChinaHungaryIBRD onlyIcelandIDA & IBRD totalIDA blendIDA onlyIDA totalIndiaIndonesiaIran, Islamic Rep.IraqIrelandIsraelItalyJamaicaJapanJordanKazakhstanKenyaKiribatiKorea, Rep.KosovoKuwaitKyrgyz RepublicLao PDRLate-demographic dividendLatin America & Caribbean Latin America & Caribbean (excluding high income)Latin America & the Caribbean (IDA & IBRD countries)LatviaLeast developed countries: UN classificationLebanonLesothoLiberiaLibyaLithuaniaLow & middle incomeLow incomeLower middle incomeLuxembourgMacao SAR, ChinaMacedonia, FYRMadagascarMalawiMalaysiaMaldivesMaliMaltaMarshall IslandsMauritaniaMauritiusMexicoMicronesia, Fed. Sts.Middle East & North AfricaMiddle East & North Africa (excluding high income)Middle East & North Africa (IDA & IBRD countries)Middle incomeMoldovaMongoliaMontenegroMoroccoMozambiqueMyanmarNamibiaNauruNepalNetherlandsNew CaledoniaNew ZealandNicaraguaNigerNigeriaNorth AmericaNorwayOECD membersOmanOther small statesPacific island small statesPakistanPalauPanamaPapua New GuineaParaguayPeruPhilippinesPolandPortugalPost-demographic dividendPre-demographic dividendQatarRomaniaRussian FederationRwandaSamoaSao Tome and PrincipeSaudi ArabiaSenegalSerbiaSeychellesSierra LeoneSingaporeSlovak RepublicSloveniaSmall statesSolomon IslandsSomaliaSouth AfricaSouth AsiaSouth Asia (IDA & IBRD)South SudanSpainSri LankaSt. Kitts and NevisSt. LuciaSt. Vincent and the GrenadinesSub-Saharan Africa Sub-Saharan Africa (excluding high income)Sub-Saharan Africa (IDA & IBRD countries)SudanSurinameSwazilandSwedenSwitzerlandSyrian Arab RepublicTajikistanTanzaniaThailandTimor-LesteTogoTongaTrinidad and TobagoTunisiaTurkeyTurkmenistanTuvaluUgandaUkraineUnited Arab EmiratesUnited KingdomUnited StatesUpper middle incomeUruguayUzbekistanVanuatuVenezuela, RBVietnamWest Bank and GazaWorldYemen, Rep.ZambiaZimbabwe Linea del tempo:
Questa scala temporale mostra un grafico dal 1971 anno al 2014 anno. Venezuela, RB. I dati fino ad 1970 anno non disponibili. Il numero di osservazioni attuali secondo i date: 44.
La fonte (nome):
Indicatori dello sviluppo mondiale
La fonte (organizzazione):
International Monetary Fund, International Financial Statistics and Balance of Payments databases, World Bank, International Debt Statistics, and World Bank and OECD GDP estimates.
Categorie:
Economy & Growth, Financial Sector, Climate Change
sono stati aggiornati
23 apr 2017 anni
Indicatori delle variazioni dei valori per anni
Minima:
-2.457
1 gen 1977 anni
Massimo:
7.225
1 gen 1998 anni
Alla data di osservazione
Valore
Variazione assoluta
La variazione rispetto al valore precedente
1 gen 1971 anni
-0.179
-0.179
0.0%
1 gen 1972 anni
1.443
+1.622
-905.96%
1 gen 1973 anni
-2.361
-3.804
-263.68%
1 gen 1974 anni
-0.432
+1.93
-81.73%
1 gen 1975 anni
-1.483
-1.052
243.79%
1 gen 1976 anni
1.335
+2.819
-190.01%
1 gen 1977 anni
-2.457
-3.792
-283.98%
1 gen 1978 anni
-0.007
+2.45
-99.71%
1 gen 1979 anni
0.144
+0.151
-2.13 Mille.%
1 gen 1980 anni
0.158
+0.014
9.57%
1 gen 1981 anni
0.082
-0.076
-48.1%
1 gen 1982 anni
0.244
+0.162
197.48%
1 gen 1983 anni
0.336
+0.092
37.5%
1 gen 1984 anni
0.109
-0.226
-67.38%
1 gen 1985 anni
0.032
-0.077
-70.69%
1 gen 1986 anni
0.117
+0.085
265.75%
1 gen 1987 anni
0.027
-0.09
-76.81%
1 gen 1988 anni
0.046
+0.019
70.18%
1 gen 1989 anni
0.152
+0.106
228.9%
1 gen 1990 anni
0.506
+0.353
231.99%
1 gen 1991 anni
0.959
+0.453
89.64%
1 gen 1992 anni
3.702
+2.743
286.08%
1 gen 1993 anni
1.076
-2.626
-70.93%
1 gen 1994 anni
0.64
-0.436
-40.53%
1 gen 1995 anni
1.438
+0.798
124.71%
1 gen 1996 anni
1.315
-0.123
-8.56%
1 gen 1997 anni
3.198
+1.883
143.19%
1 gen 1998 anni
7.225
+4.027
125.92%
1 gen 1999 anni
5.458
-1.767
-24.45%
1 gen 2000 anni
2.95
-2.508
-45.96%
1 gen 2001 anni
4.015
+1.065
36.11%
1 gen 2002 anni
3.014
-1.001
-24.93%
1 gen 2003 anni
0.819
-2.195
-72.82%
1 gen 2004 anni
1.881
+1.062
129.62%
1 gen 2005 anni
1.324
-0.557
-29.61%
1 gen 2006 anni
1.684
+0.36
27.16%
1 gen 2007 anni
0.108
-1.576
-93.59%
1 gen 2008 anni
1.892
+1.784
1.65 Mille.%
1 gen 2009 anni
0.66
-1.232
-65.11%
1 gen 2010 anni
-0.345
-1.005
-152.29%
1 gen 2011 anni
0.402
+0.747
-216.46%
1 gen 2012 anni
1.85
+1.448
360.23%
1 gen 2013 anni
1.308
-0.542
-29.32%
1 gen 2014 anni
0.578
-0.73
-55.83%
Classificazione dei paesi secondo i statistiche attuali per anni


Commenti: