29
/it/
it
AIzaSyAYiBZKx7MnpbEhh9jyipgxe19OcubqV5w
April 1, 2024
211690
Niger
NER
true
2
1
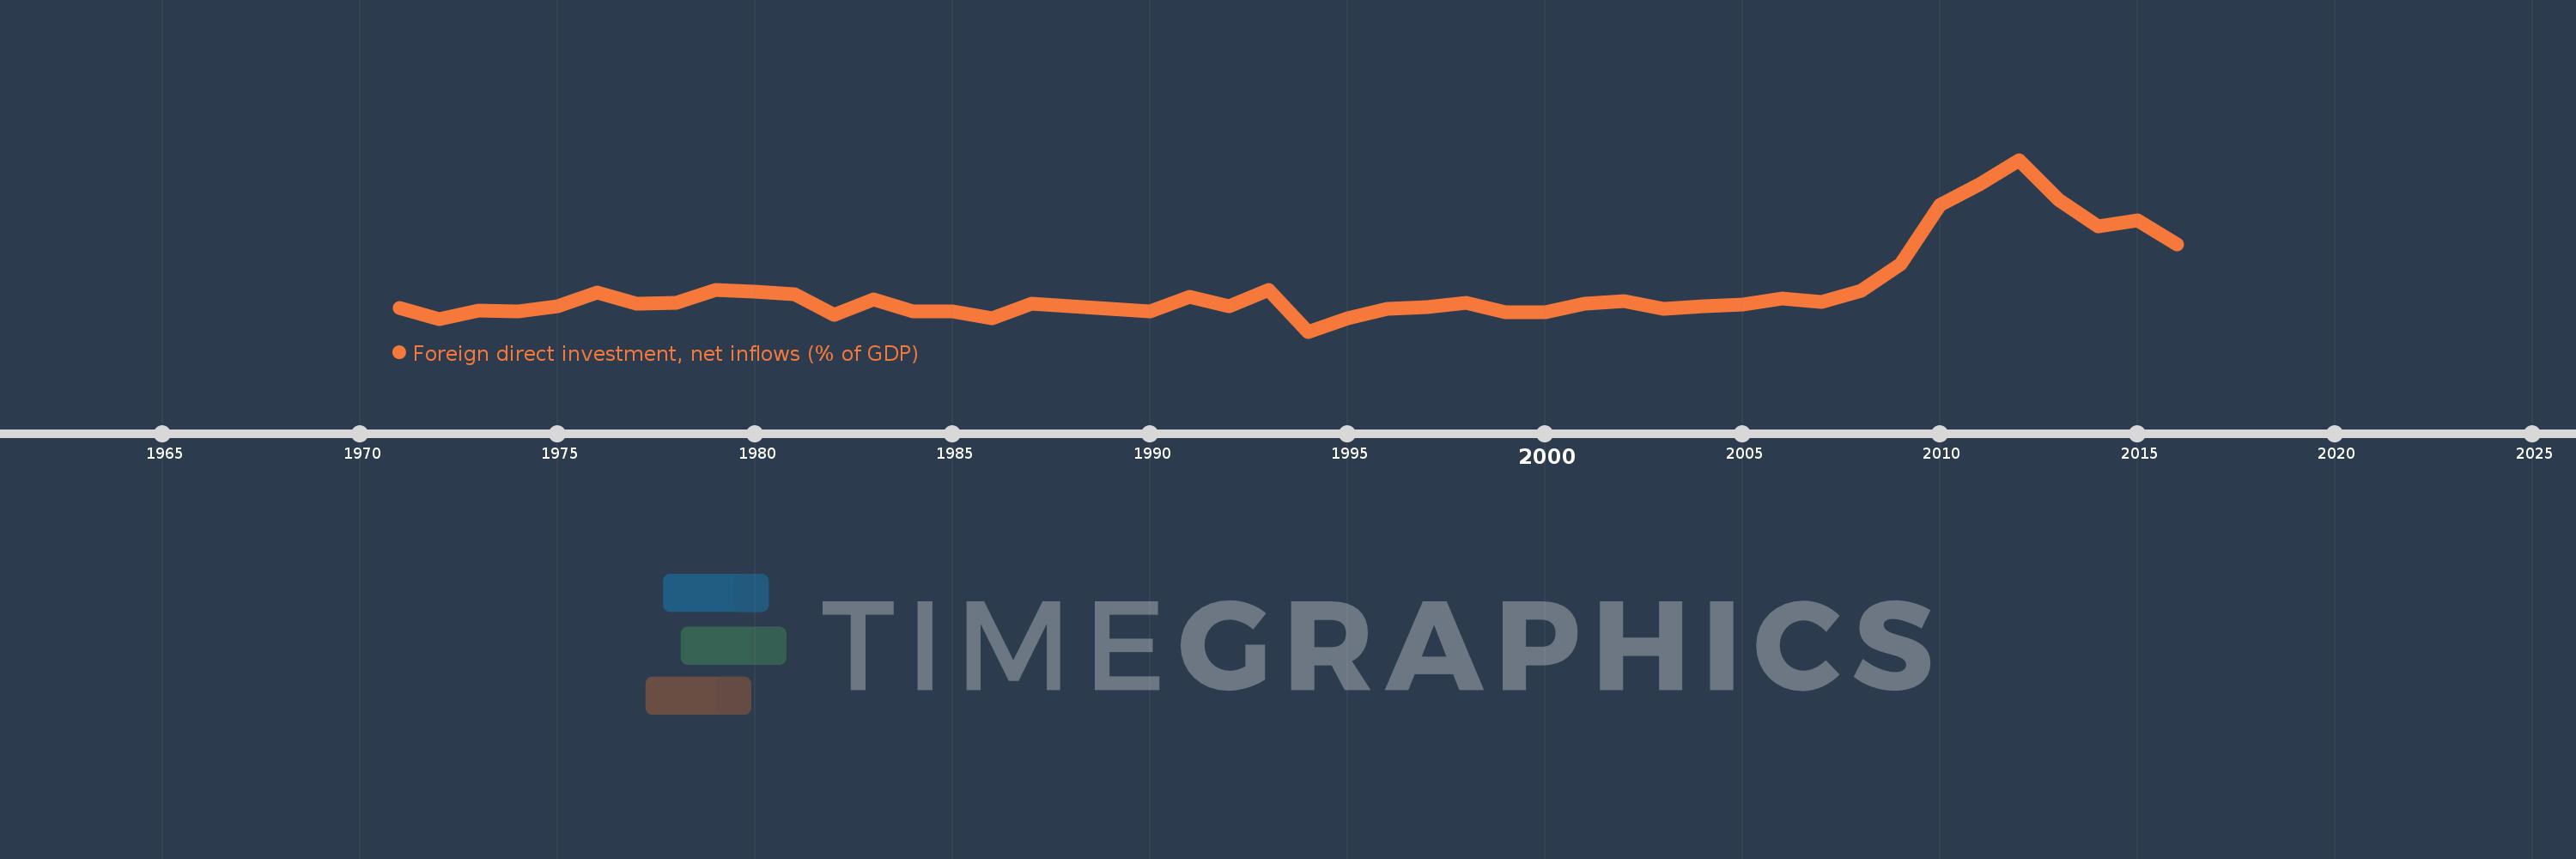
Foreign direct investment, net inflows (% of GDP)
2016,2015,2014,2013,2012,2011,2010,2009,2008,2007,2006,2005,2004,2003,2002,2001,2000,1999,1998,1997,1996,1995,1994,1993,1992,1991,1990,1989,1988,1987,1986,1985,1984,1983,1982,1981,1980,1979,1978,1977,1976,1975,1974,1973,1972,1971
Queste statistiche in altri paesi:
AfghanistanAlbaniaAlgeriaAngolaAntigua and BarbudaArab WorldArgentinaArmeniaArubaAustraliaAustriaAzerbaijanBahamas, TheBahrainBangladeshBarbadosBelarusBelgiumBelizeBeninBermudaBhutanBoliviaBosnia and HerzegovinaBotswanaBrazilBrunei DarussalamBulgariaBurkina FasoBurundiCabo VerdeCambodiaCameroonCanadaCaribbean small statesCayman IslandsCentral African RepublicCentral Europe and the BalticsChadChileChinaColombiaComorosCongo, Dem. Rep.Congo, Rep.Costa RicaCote d'IvoireCroatiaCyprusCzech RepublicDenmarkDjiboutiDominicaDominican RepublicEarly-demographic dividendEast Asia & PacificEast Asia & Pacific (excluding high income)East Asia & Pacific (IDA & IBRD countries)EcuadorEgypt, Arab Rep.El SalvadorEquatorial GuineaEritreaEstoniaEthiopiaEuro areaEurope & Central AsiaEurope & Central Asia (excluding high income)Europe & Central Asia (IDA & IBRD countries)European UnionFijiFinlandFragile and conflict affected situationsFranceFrench PolynesiaGabonGambia, TheGeorgiaGermanyGhanaGreeceGrenadaGuatemalaGuineaGuinea-BissauGuyanaHaitiHeavily indebted poor countries (HIPC)High incomeHondurasHong Kong SAR, ChinaHungaryIBRD onlyIcelandIDA & IBRD totalIDA blendIDA onlyIDA totalIndiaIndonesiaIran, Islamic Rep.IraqIrelandIsraelItalyJamaicaJapanJordanKazakhstanKenyaKiribatiKorea, Rep.KosovoKuwaitKyrgyz RepublicLao PDRLate-demographic dividendLatin America & Caribbean Latin America & Caribbean (excluding high income)Latin America & the Caribbean (IDA & IBRD countries)LatviaLeast developed countries: UN classificationLebanonLesothoLiberiaLibyaLithuaniaLow & middle incomeLow incomeLower middle incomeLuxembourgMacao SAR, ChinaMacedonia, FYRMadagascarMalawiMalaysiaMaldivesMaliMaltaMarshall IslandsMauritaniaMauritiusMexicoMicronesia, Fed. Sts.Middle East & North AfricaMiddle East & North Africa (excluding high income)Middle East & North Africa (IDA & IBRD countries)Middle incomeMoldovaMongoliaMontenegroMoroccoMozambiqueMyanmarNamibiaNauruNepalNetherlandsNew CaledoniaNew ZealandNicaraguaNigerNigeriaNorth AmericaNorwayOECD membersOmanOther small statesPacific island small statesPakistanPalauPanamaPapua New GuineaParaguayPeruPhilippinesPolandPortugalPost-demographic dividendPre-demographic dividendQatarRomaniaRussian FederationRwandaSamoaSao Tome and PrincipeSaudi ArabiaSenegalSerbiaSeychellesSierra LeoneSingaporeSlovak RepublicSloveniaSmall statesSolomon IslandsSomaliaSouth AfricaSouth AsiaSouth Asia (IDA & IBRD)South SudanSpainSri LankaSt. Kitts and NevisSt. LuciaSt. Vincent and the GrenadinesSub-Saharan Africa Sub-Saharan Africa (excluding high income)Sub-Saharan Africa (IDA & IBRD countries)SudanSurinameSwazilandSwedenSwitzerlandSyrian Arab RepublicTajikistanTanzaniaThailandTimor-LesteTogoTongaTrinidad and TobagoTunisiaTurkeyTurkmenistanTuvaluUgandaUkraineUnited Arab EmiratesUnited KingdomUnited StatesUpper middle incomeUruguayUzbekistanVanuatuVenezuela, RBVietnamWest Bank and GazaWorldYemen, Rep.ZambiaZimbabwe Linea del tempo:
Questa scala temporale mostra un grafico dal 1971 anno al 2016 anno. Niger. I dati fino ad 1970 anno non disponibili. Il numero di osservazioni attuali secondo i date: 46.
La fonte (nome):
Indicatori dello sviluppo mondiale
La fonte (organizzazione):
International Monetary Fund, International Financial Statistics and Balance of Payments databases, World Bank, International Debt Statistics, and World Bank and OECD GDP estimates.
Categorie:
Economy & Growth, Financial Sector, Climate Change
sono stati aggiornati
23 apr 2017 anni
Indicatori delle variazioni dei valori per anni
Minima:
-2.138
1 gen 1994 anni
Massimo:
16.629
1 gen 2012 anni
Alla data di osservazione
Valore
Variazione assoluta
La variazione rispetto al valore precedente
1 gen 1971 anni
0.419
+0.419
0.0%
1 gen 1972 anni
-0.764
-1.183
-282.59%
1 gen 1973 anni
0.121
+0.885
-115.86%
1 gen 1974 anni
0.106
-0.016
-12.79%
1 gen 1975 anni
0.673
+0.568
537.19%
1 gen 1976 anni
2.151
+1.478
219.45%
1 gen 1977 anni
0.929
-1.222
-56.81%
1 gen 1978 anni
0.995
+0.066
7.11%
1 gen 1979 anni
2.404
+1.409
141.62%
1 gen 1980 anni
2.218
-0.186
-7.73%
1 gen 1981 anni
1.958
-0.26
-11.73%
1 gen 1982 anni
-0.282
-2.24
-114.38%
1 gen 1983 anni
1.398
+1.68
-596.67%
1 gen 1984 anni
0.067
-1.331
-95.18%
1 gen 1985 anni
0.099
+0.032
46.89%
1 gen 1986 anni
-0.651
-0.75
-757.97%
1 gen 1987 anni
0.924
+1.575
-241.9%
1 gen 1988 anni
0.664
-0.261
-28.2%
1 gen 1989 anni
0.303
-0.361
-54.36%
1 gen 1990 anni
0.035
-0.268
-88.46%
1 gen 1991 anni
1.645
+1.61
4.61 Mille.%
1 gen 1992 anni
0.651
-0.994
-60.43%
1 gen 1993 anni
2.405
+1.754
269.33%
1 gen 1994 anni
-2.138
-4.543
-188.92%
1 gen 1995 anni
-0.72
+1.418
-66.31%
1 gen 1996 anni
0.382
+1.102
-153.06%
1 gen 1997 anni
0.497
+0.115
29.97%
1 gen 1998 anni
0.985
+0.488
98.21%
1 gen 1999 anni
-0.049
-1.034
-105.01%
1 gen 2000 anni
0.014
+0.063
-127.75%
1 gen 2001 anni
0.875
+0.861
6.29 Mille.%
1 gen 2002 anni
1.16
+0.286
32.65%
1 gen 2003 anni
0.359
-0.801
-69.06%
1 gen 2004 anni
0.677
+0.318
88.57%
1 gen 2005 anni
0.798
+0.121
17.93%
1 gen 2006 anni
1.461
+0.662
82.99%
1 gen 2007 anni
1.104
-0.356
-24.39%
1 gen 2008 anni
2.306
+1.201
108.77%
1 gen 2009 anni
5.218
+2.912
126.31%
1 gen 2010 anni
11.697
+6.479
124.17%
1 gen 2011 anni
13.917
+2.22
18.98%
1 gen 2012 anni
16.629
+2.712
19.49%
1 gen 2013 anni
12.259
-4.371
-26.28%
1 gen 2014 anni
9.378
-2.88
-23.5%
1 gen 2015 anni
9.968
+0.589
6.28%
1 gen 2016 anni
7.35
-2.618
-26.27%
Classificazione dei paesi secondo i statistiche attuali per anni


Commenti: