29
/it/
it
AIzaSyAYiBZKx7MnpbEhh9jyipgxe19OcubqV5w
April 1, 2024
160469
Israel
ISR
true
2
1
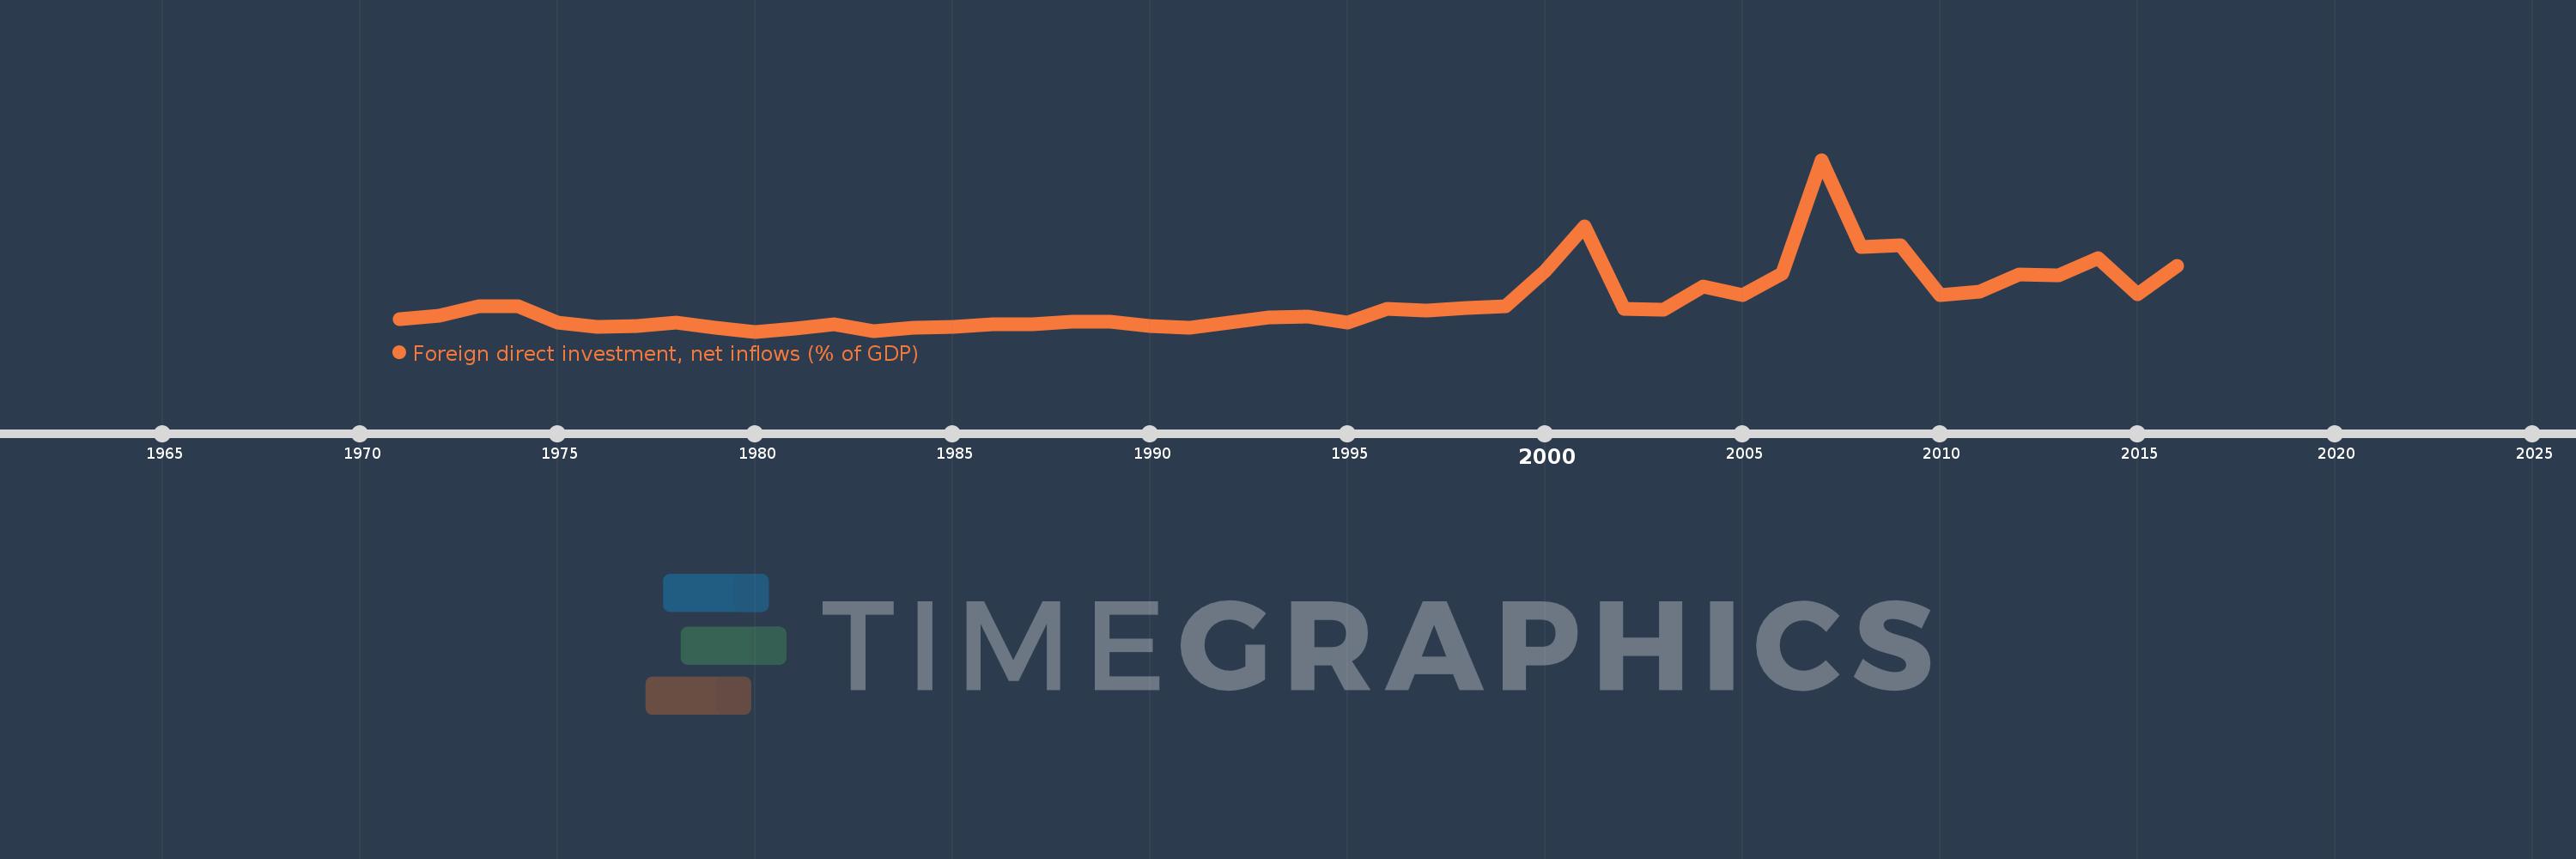
Foreign direct investment, net inflows (% of GDP)
2016,2015,2014,2013,2012,2011,2010,2009,2008,2007,2006,2005,2004,2003,2002,2001,2000,1999,1998,1997,1996,1995,1994,1993,1992,1991,1990,1989,1988,1987,1986,1985,1984,1983,1982,1981,1980,1979,1978,1977,1976,1975,1974,1973,1972,1971
Queste statistiche in altri paesi:
AfghanistanAlbaniaAlgeriaAngolaAntigua and BarbudaArab WorldArgentinaArmeniaArubaAustraliaAustriaAzerbaijanBahamas, TheBahrainBangladeshBarbadosBelarusBelgiumBelizeBeninBermudaBhutanBoliviaBosnia and HerzegovinaBotswanaBrazilBrunei DarussalamBulgariaBurkina FasoBurundiCabo VerdeCambodiaCameroonCanadaCaribbean small statesCayman IslandsCentral African RepublicCentral Europe and the BalticsChadChileChinaColombiaComorosCongo, Dem. Rep.Congo, Rep.Costa RicaCote d'IvoireCroatiaCyprusCzech RepublicDenmarkDjiboutiDominicaDominican RepublicEarly-demographic dividendEast Asia & PacificEast Asia & Pacific (excluding high income)East Asia & Pacific (IDA & IBRD countries)EcuadorEgypt, Arab Rep.El SalvadorEquatorial GuineaEritreaEstoniaEthiopiaEuro areaEurope & Central AsiaEurope & Central Asia (excluding high income)Europe & Central Asia (IDA & IBRD countries)European UnionFijiFinlandFragile and conflict affected situationsFranceFrench PolynesiaGabonGambia, TheGeorgiaGermanyGhanaGreeceGrenadaGuatemalaGuineaGuinea-BissauGuyanaHaitiHeavily indebted poor countries (HIPC)High incomeHondurasHong Kong SAR, ChinaHungaryIBRD onlyIcelandIDA & IBRD totalIDA blendIDA onlyIDA totalIndiaIndonesiaIran, Islamic Rep.IraqIrelandIsraelItalyJamaicaJapanJordanKazakhstanKenyaKiribatiKorea, Rep.KosovoKuwaitKyrgyz RepublicLao PDRLate-demographic dividendLatin America & Caribbean Latin America & Caribbean (excluding high income)Latin America & the Caribbean (IDA & IBRD countries)LatviaLeast developed countries: UN classificationLebanonLesothoLiberiaLibyaLithuaniaLow & middle incomeLow incomeLower middle incomeLuxembourgMacao SAR, ChinaMacedonia, FYRMadagascarMalawiMalaysiaMaldivesMaliMaltaMarshall IslandsMauritaniaMauritiusMexicoMicronesia, Fed. Sts.Middle East & North AfricaMiddle East & North Africa (excluding high income)Middle East & North Africa (IDA & IBRD countries)Middle incomeMoldovaMongoliaMontenegroMoroccoMozambiqueMyanmarNamibiaNauruNepalNetherlandsNew CaledoniaNew ZealandNicaraguaNigerNigeriaNorth AmericaNorwayOECD membersOmanOther small statesPacific island small statesPakistanPalauPanamaPapua New GuineaParaguayPeruPhilippinesPolandPortugalPost-demographic dividendPre-demographic dividendQatarRomaniaRussian FederationRwandaSamoaSao Tome and PrincipeSaudi ArabiaSenegalSerbiaSeychellesSierra LeoneSingaporeSlovak RepublicSloveniaSmall statesSolomon IslandsSomaliaSouth AfricaSouth AsiaSouth Asia (IDA & IBRD)South SudanSpainSri LankaSt. Kitts and NevisSt. LuciaSt. Vincent and the GrenadinesSub-Saharan Africa Sub-Saharan Africa (excluding high income)Sub-Saharan Africa (IDA & IBRD countries)SudanSurinameSwazilandSwedenSwitzerlandSyrian Arab RepublicTajikistanTanzaniaThailandTimor-LesteTogoTongaTrinidad and TobagoTunisiaTurkeyTurkmenistanTuvaluUgandaUkraineUnited Arab EmiratesUnited KingdomUnited StatesUpper middle incomeUruguayUzbekistanVanuatuVenezuela, RBVietnamWest Bank and GazaWorldYemen, Rep.ZambiaZimbabwe Linea del tempo:
Questa scala temporale mostra un grafico dal 1971 anno al 2016 anno. Israel. I dati fino ad 1970 anno non disponibili. Il numero di osservazioni attuali secondo i date: 46.
La fonte (nome):
Indicatori dello sviluppo mondiale
La fonte (organizzazione):
International Monetary Fund, International Financial Statistics and Balance of Payments databases, World Bank, International Debt Statistics, and World Bank and OECD GDP estimates.
Categorie:
Economy & Growth, Financial Sector, Climate Change
sono stati aggiornati
23 apr 2017 anni
Indicatori delle variazioni dei valori per anni
Minima:
0.062
1 gen 1980 anni
Massimo:
9.899
1 gen 2007 anni
Alla data di osservazione
Valore
Variazione assoluta
La variazione rispetto al valore precedente
1 gen 1971 anni
0.782
+0.782
0.0%
1 gen 1972 anni
0.974
+0.192
24.59%
1 gen 1973 anni
1.521
+0.547
56.12%
1 gen 1974 anni
1.537
+0.017
1.09%
1 gen 1975 anni
0.601
-0.937
-60.93%
1 gen 1976 anni
0.345
-0.255
-42.49%
1 gen 1977 anni
0.38
+0.035
10.09%
1 gen 1978 anni
0.563
+0.183
48.03%
1 gen 1979 anni
0.279
-0.284
-50.4%
1 gen 1980 anni
0.062
-0.217
-77.86%
1 gen 1981 anni
0.233
+0.171
277.02%
1 gen 1982 anni
0.492
+0.259
111.06%
1 gen 1983 anni
0.087
-0.405
-82.35%
1 gen 1984 anni
0.286
+0.199
229.56%
1 gen 1985 anni
0.344
+0.058
20.14%
1 gen 1986 anni
0.466
+0.122
35.47%
1 gen 1987 anni
0.483
+0.017
3.7%
1 gen 1988 anni
0.632
+0.149
30.84%
1 gen 1989 anni
0.609
-0.023
-3.63%
1 gen 1990 anni
0.36
-0.249
-40.92%
1 gen 1991 anni
0.288
-0.072
-20.01%
1 gen 1992 anni
0.584
+0.296
103.04%
1 gen 1993 anni
0.895
+0.311
53.19%
1 gen 1994 anni
0.918
+0.023
2.55%
1 gen 1995 anni
0.591
-0.326
-35.55%
1 gen 1996 anni
1.351
+0.759
128.39%
1 gen 1997 anni
1.273
-0.078
-5.78%
1 gen 1998 anni
1.426
+0.154
12.07%
1 gen 1999 anni
1.5
+0.074
5.15%
1 gen 2000 anni
3.541
+2.041
136.06%
1 gen 2001 anni
6.078
+2.538
71.68%
1 gen 2002 anni
1.355
-4.724
-77.71%
1 gen 2003 anni
1.307
-0.048
-3.53%
1 gen 2004 anni
2.621
+1.314
100.55%
1 gen 2005 anni
2.176
-0.445
-16.97%
1 gen 2006 anni
3.373
+1.197
55.01%
1 gen 2007 anni
9.899
+6.526
193.46%
1 gen 2008 anni
4.9
-5.0
-50.5%
1 gen 2009 anni
5.017
+0.117
2.39%
1 gen 2010 anni
2.133
-2.884
-57.48%
1 gen 2011 anni
2.357
+0.224
10.5%
1 gen 2012 anni
3.339
+0.982
41.67%
1 gen 2013 anni
3.287
-0.053
-1.57%
1 gen 2014 anni
4.244
+0.957
29.13%
1 gen 2015 anni
2.182
-2.062
-48.58%
1 gen 2016 anni
3.844
+1.662
76.16%
Classificazione dei paesi secondo i statistiche attuali per anni


Commenti: