29
/it/
it
AIzaSyAYiBZKx7MnpbEhh9jyipgxe19OcubqV5w
April 1, 2024
280908
Venezuela, RB
VEN
true
2
1
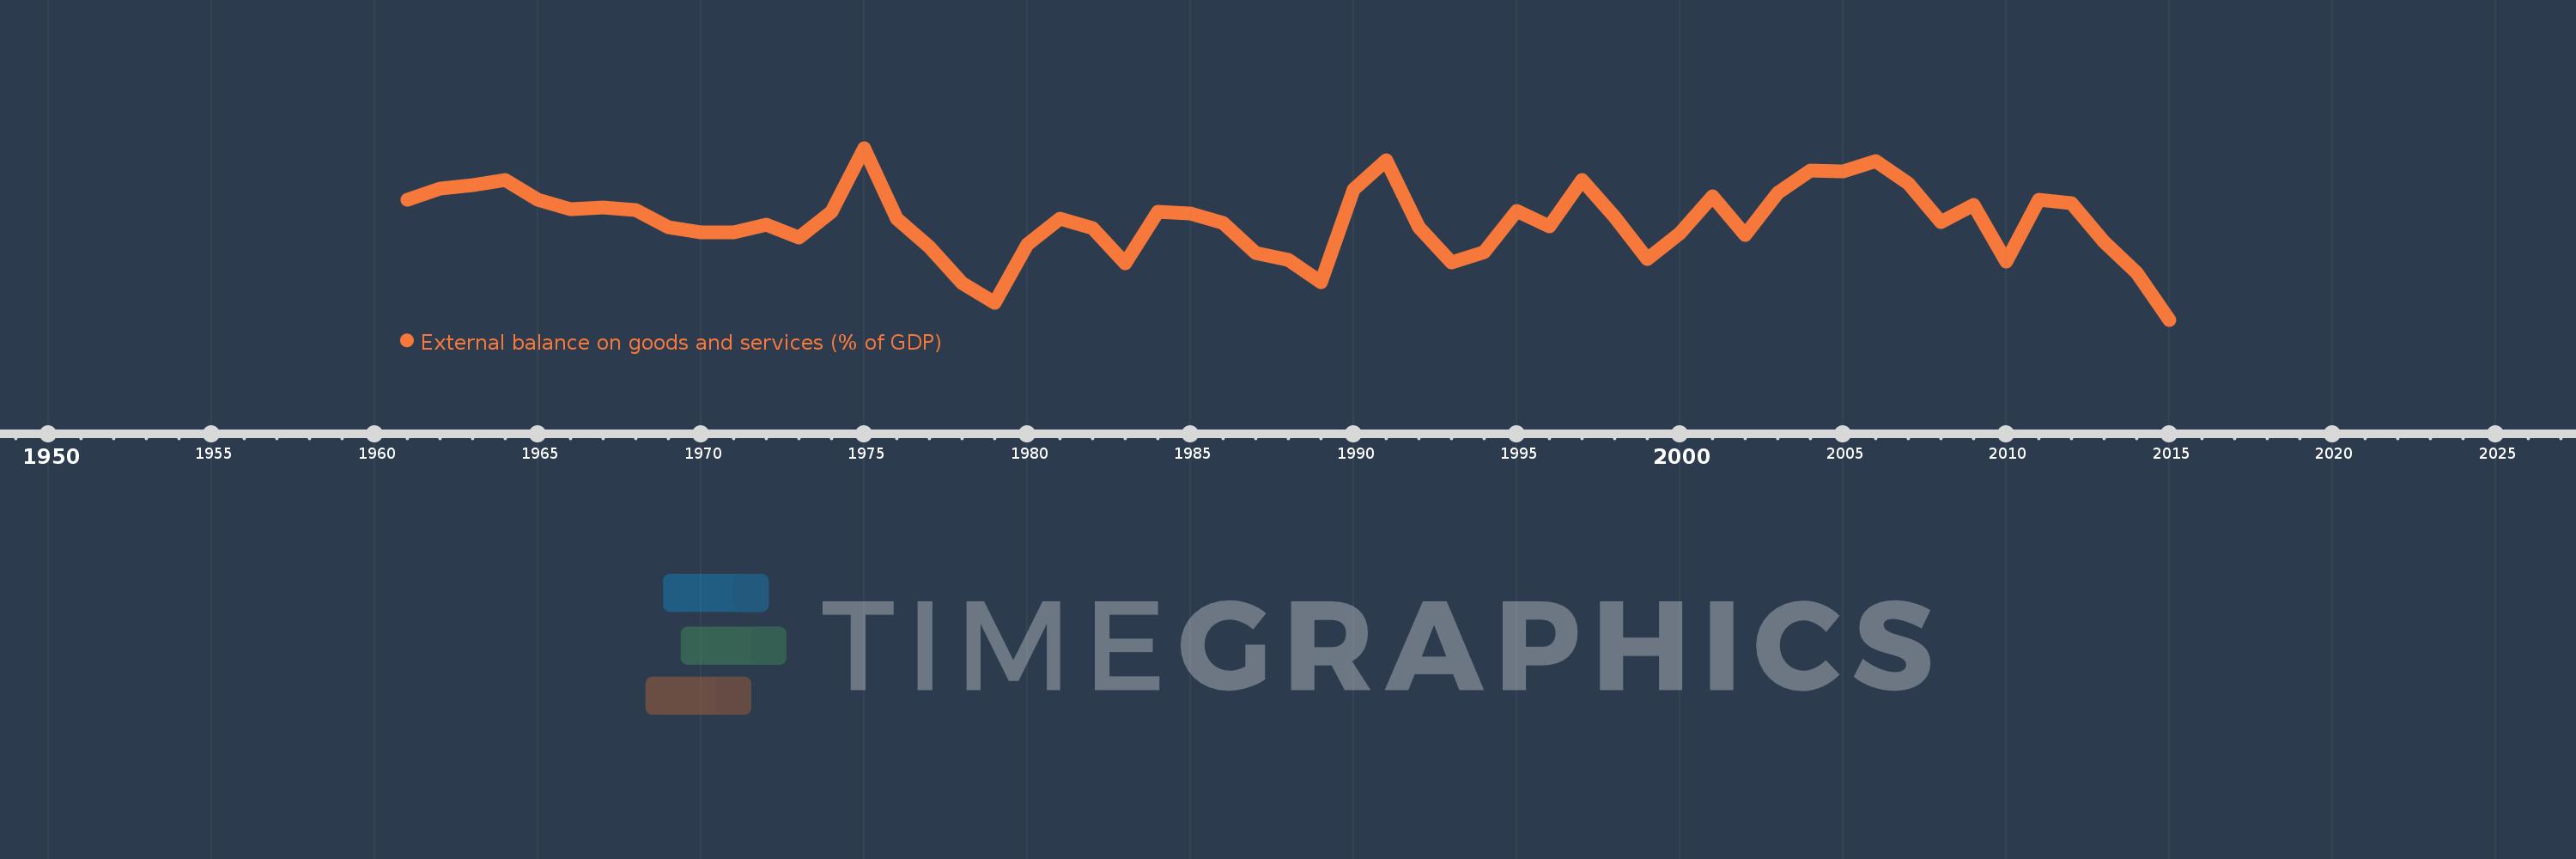
External balance on goods and services (% of GDP)
2015,2014,2013,2012,2011,2010,2009,2008,2007,2006,2005,2004,2003,2002,2001,2000,1999,1998,1997,1996,1995,1994,1993,1992,1991,1990,1989,1988,1987,1986,1985,1984,1983,1982,1981,1980,1979,1978,1977,1976,1975,1974,1973,1972,1971,1970,1969,1968,1967,1966,1965,1964,1963,1962,1961
Queste statistiche in altri paesi:
AfghanistanAlbaniaAlgeriaAngolaAntigua and BarbudaArab WorldArgentinaArmeniaArubaAustraliaAustriaAzerbaijanBahamas, TheBahrainBangladeshBarbadosBelarusBelgiumBelizeBeninBermudaBhutanBoliviaBosnia and HerzegovinaBotswanaBrazilBrunei DarussalamBulgariaBurkina FasoBurundiCabo VerdeCambodiaCameroonCanadaCaribbean small statesCentral African RepublicCentral Europe and the BalticsChadChileChinaColombiaComorosCongo, Dem. Rep.Congo, Rep.Costa RicaCote d'IvoireCroatiaCubaCyprusCzech RepublicDenmarkDjiboutiDominicaDominican RepublicEarly-demographic dividendEast Asia & PacificEast Asia & Pacific (excluding high income)East Asia & Pacific (IDA & IBRD countries)EcuadorEgypt, Arab Rep.El SalvadorEquatorial GuineaEritreaEstoniaEthiopiaEuro areaEurope & Central AsiaEurope & Central Asia (excluding high income)Europe & Central Asia (IDA & IBRD countries)European UnionFaroe IslandsFijiFinlandFragile and conflict affected situationsFranceFrench PolynesiaGabonGambia, TheGeorgiaGermanyGhanaGreeceGrenadaGuatemalaGuineaGuinea-BissauGuyanaHaitiHeavily indebted poor countries (HIPC)High incomeHondurasHong Kong SAR, ChinaHungaryIBRD onlyIcelandIDA & IBRD totalIDA blendIDA onlyIDA totalIndiaIndonesiaIran, Islamic Rep.IraqIrelandIsraelItalyJamaicaJapanJordanKazakhstanKenyaKiribatiKorea, Rep.KosovoKuwaitKyrgyz RepublicLao PDRLate-demographic dividendLatin America & Caribbean Latin America & Caribbean (excluding high income)Latin America & the Caribbean (IDA & IBRD countries)LatviaLeast developed countries: UN classificationLebanonLesothoLiberiaLibyaLithuaniaLow & middle incomeLow incomeLower middle incomeLuxembourgMacao SAR, ChinaMacedonia, FYRMadagascarMalawiMalaysiaMaldivesMaliMaltaMauritaniaMauritiusMexicoMicronesia, Fed. Sts.Middle East & North AfricaMiddle East & North Africa (excluding high income)Middle East & North Africa (IDA & IBRD countries)Middle incomeMoldovaMongoliaMontenegroMoroccoMozambiqueMyanmarNamibiaNepalNetherlandsNew CaledoniaNew ZealandNicaraguaNigerNigeriaNorth AmericaNorwayOECD membersOmanOther small statesPacific island small statesPakistanPalauPanamaPapua New GuineaParaguayPeruPhilippinesPolandPortugalPost-demographic dividendPre-demographic dividendPuerto RicoQatarRomaniaRussian FederationRwandaSamoaSaudi ArabiaSenegalSerbiaSeychellesSierra LeoneSingaporeSlovak RepublicSloveniaSmall statesSolomon IslandsSomaliaSouth AfricaSouth AsiaSouth Asia (IDA & IBRD)South SudanSpainSri LankaSt. Kitts and NevisSt. LuciaSt. Vincent and the GrenadinesSub-Saharan Africa Sub-Saharan Africa (excluding high income)Sub-Saharan Africa (IDA & IBRD countries)SudanSurinameSwazilandSwedenSwitzerlandSyrian Arab RepublicTajikistanTanzaniaThailandTimor-LesteTogoTongaTrinidad and TobagoTunisiaTurkeyTurkmenistanUgandaUkraineUnited Arab EmiratesUnited KingdomUnited StatesUpper middle incomeUruguayUzbekistanVanuatuVenezuela, RBVietnamWest Bank and GazaWorldYemen, Rep.ZambiaZimbabwe Linea del tempo:
Questa scala temporale mostra un grafico dal 1961 anno al 2015 anno. Venezuela, RB. I dati fino ad 1960 anno non disponibili. Il numero di osservazioni attuali secondo i date: 55.
La fonte (nome):
Indicatori dello sviluppo mondiale
La fonte (organizzazione):
World Bank national accounts data, and OECD National Accounts data files.
Categorie:
Economy & Growth, Trade
sono stati aggiornati
23 apr 2017 anni
Indicatori delle variazioni dei valori per anni
Minima:
-14.703
1 gen 2015 anni
Massimo:
21.972
1 gen 1975 anni
Alla data di osservazione
Valore
Variazione assoluta
La variazione rispetto al valore precedente
1 gen 1961 anni
10.938
+10.938
0.0%
1 gen 1962 anni
13.358
+2.42
22.12%
1 gen 1963 anni
14.08
+0.722
5.4%
1 gen 1964 anni
15.192
+1.112
7.9%
1 gen 1965 anni
10.832
-4.36
-28.7%
1 gen 1966 anni
8.831
-2.001
-18.47%
1 gen 1967 anni
9.261
+0.43
4.87%
1 gen 1968 anni
8.721
-0.54
-5.83%
1 gen 1969 anni
5.118
-3.603
-41.31%
1 gen 1970 anni
4.011
-1.107
-21.63%
1 gen 1971 anni
4.017
+0.006
0.14%
1 gen 1972 anni
5.564
+1.547
38.52%
1 gen 1973 anni
2.901
-2.663
-47.87%
1 gen 1974 anni
8.324
+5.423
186.96%
1 gen 1975 anni
21.972
+13.648
163.97%
1 gen 1976 anni
6.902
-15.071
-68.59%
1 gen 1977 anni
0.746
-6.155
-89.19%
1 gen 1978 anni
-6.816
-7.562
-1.01 Mille.%
1 gen 1979 anni
-11.149
-4.333
63.57%
1 gen 1980 anni
1.294
+12.443
-111.61%
1 gen 1981 anni
6.951
+5.657
437.18%
1 gen 1982 anni
4.927
-2.024
-29.12%
1 gen 1983 anni
-2.616
-7.543
-153.1%
1 gen 1984 anni
8.309
+10.926
-417.63%
1 gen 1985 anni
8.033
-0.277
-3.33%
1 gen 1986 anni
6.052
-1.98
-24.65%
1 gen 1987 anni
-0.427
-6.48
-107.06%
1 gen 1988 anni
-1.935
-1.507
352.7%
1 gen 1989 anni
-6.662
-4.727
244.35%
1 gen 1990 anni
13.036
+19.697
-295.68%
1 gen 1991 anni
19.266
+6.23
47.8%
1 gen 1992 anni
5.126
-14.14
-73.39%
1 gen 1993 anni
-2.556
-7.682
-149.85%
1 gen 1994 anni
-0.223
+2.333
-91.28%
1 gen 1995 anni
8.564
+8.787
-3.94 Mille.%
1 gen 1996 anni
5.291
-3.273
-38.22%
1 gen 1997 anni
15.187
+9.896
187.02%
1 gen 1998 anni
7.273
-7.914
-52.11%
1 gen 1999 anni
-1.758
-9.031
-124.18%
1 gen 2000 anni
3.753
+5.512
-313.44%
1 gen 2001 anni
11.631
+7.878
209.9%
1 gen 2002 anni
3.33
-8.301
-71.37%
1 gen 2003 anni
12.291
+8.961
269.11%
1 gen 2004 anni
17.13
+4.838
39.36%
1 gen 2005 anni
17.029
-0.101
-0.59%
1 gen 2006 anni
19.19
+2.161
12.69%
1 gen 2007 anni
14.372
-4.818
-25.11%
1 gen 2008 anni
6.062
-8.31
-57.82%
1 gen 2009 anni
9.814
+3.752
61.9%
1 gen 2010 anni
-2.378
-12.192
-124.23%
1 gen 2011 anni
10.924
+13.302
-559.4%
1 gen 2012 anni
10.248
-0.676
-6.19%
1 gen 2013 anni
1.938
-8.309
-81.08%
1 gen 2014 anni
-4.748
-6.686
-344.93%
1 gen 2015 anni
-14.703
-9.955
209.68%
Classificazione dei paesi secondo i statistiche attuali per anni


Commenti: