29
/it/
it
AIzaSyAYiBZKx7MnpbEhh9jyipgxe19OcubqV5w
April 1, 2024
131932
Fiji
FJI
true
2
1
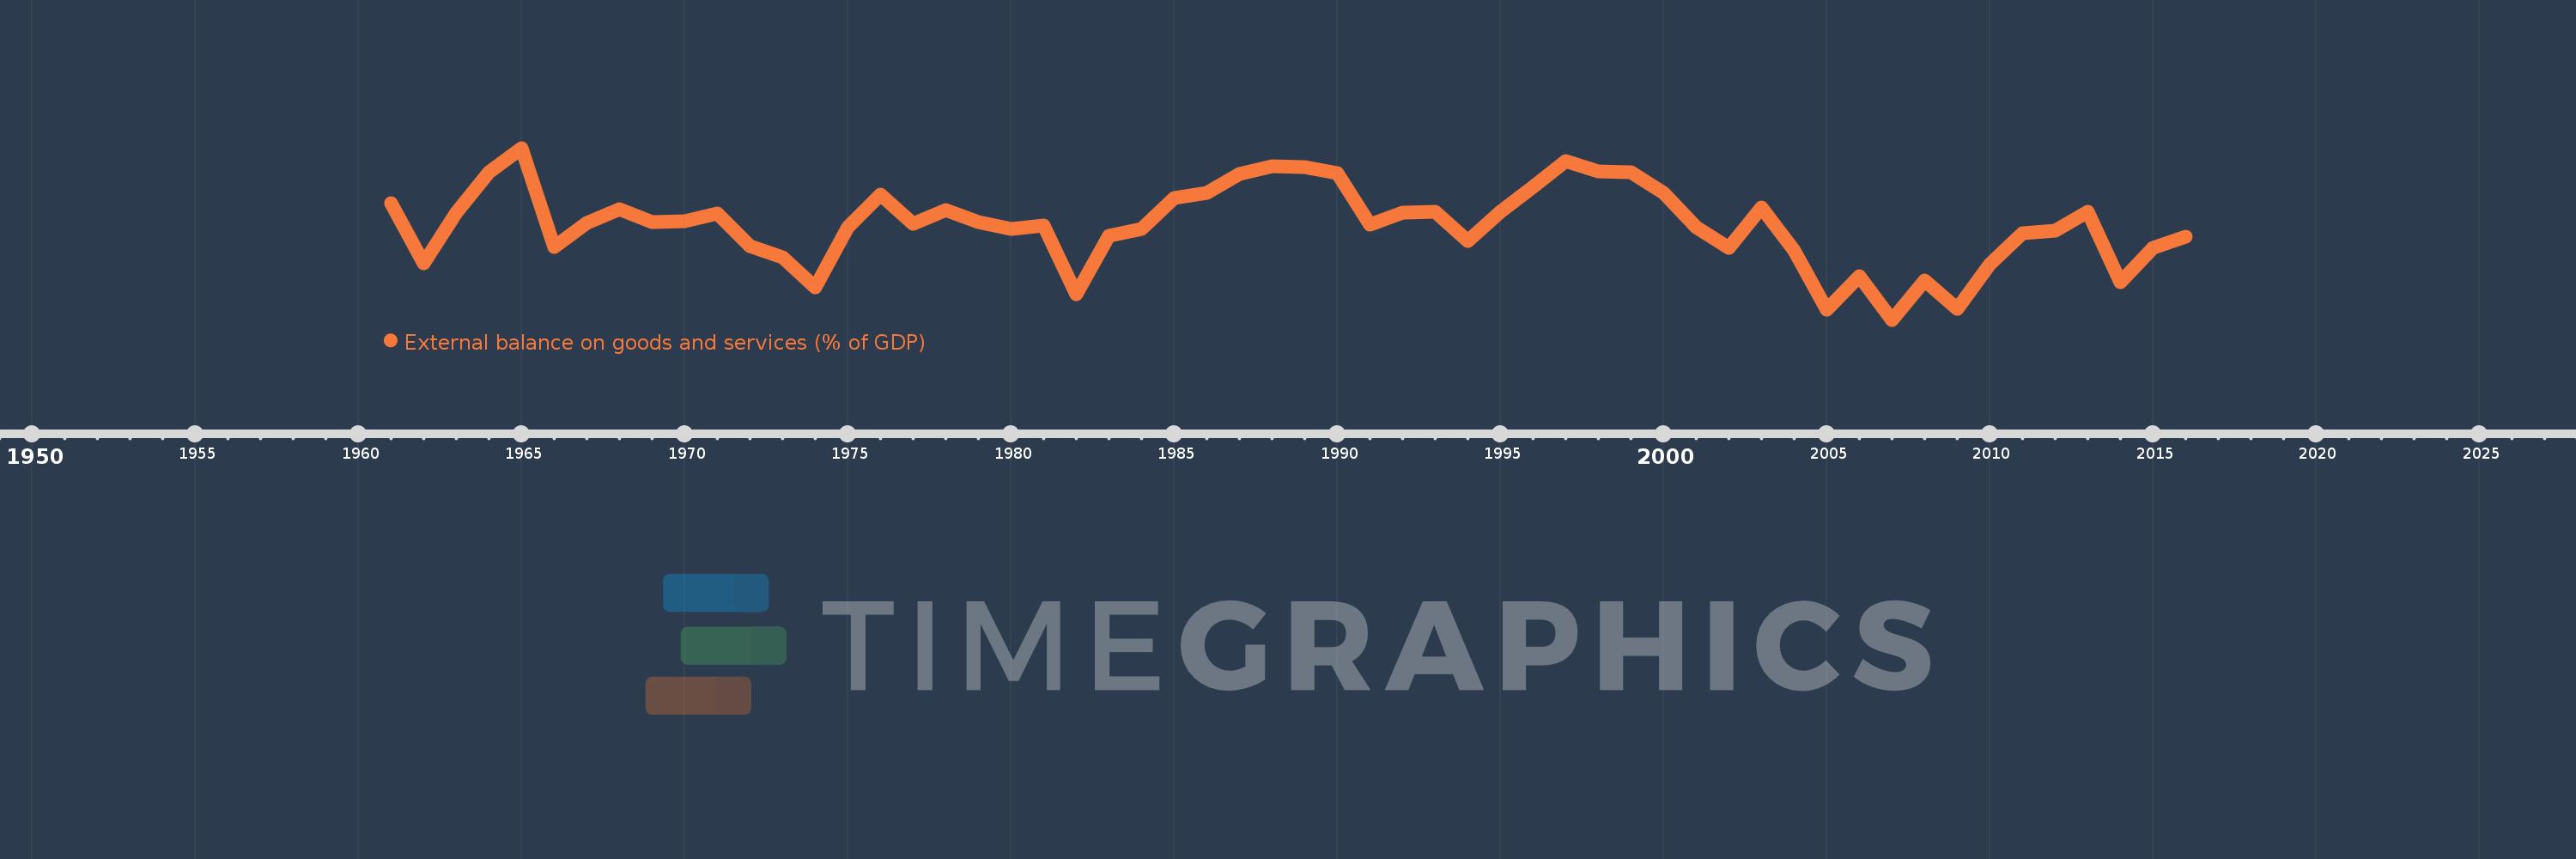
External balance on goods and services (% of GDP)
2016,2015,2014,2013,2012,2011,2010,2009,2008,2007,2006,2005,2004,2003,2002,2001,2000,1999,1998,1997,1996,1995,1994,1993,1992,1991,1990,1989,1988,1987,1986,1985,1984,1983,1982,1981,1980,1979,1978,1977,1976,1975,1974,1973,1972,1971,1970,1969,1968,1967,1966,1965,1964,1963,1962,1961
Queste statistiche in altri paesi:
AfghanistanAlbaniaAlgeriaAngolaAntigua and BarbudaArab WorldArgentinaArmeniaArubaAustraliaAustriaAzerbaijanBahamas, TheBahrainBangladeshBarbadosBelarusBelgiumBelizeBeninBermudaBhutanBoliviaBosnia and HerzegovinaBotswanaBrazilBrunei DarussalamBulgariaBurkina FasoBurundiCabo VerdeCambodiaCameroonCanadaCaribbean small statesCentral African RepublicCentral Europe and the BalticsChadChileChinaColombiaComorosCongo, Dem. Rep.Congo, Rep.Costa RicaCote d'IvoireCroatiaCubaCyprusCzech RepublicDenmarkDjiboutiDominicaDominican RepublicEarly-demographic dividendEast Asia & PacificEast Asia & Pacific (excluding high income)East Asia & Pacific (IDA & IBRD countries)EcuadorEgypt, Arab Rep.El SalvadorEquatorial GuineaEritreaEstoniaEthiopiaEuro areaEurope & Central AsiaEurope & Central Asia (excluding high income)Europe & Central Asia (IDA & IBRD countries)European UnionFaroe IslandsFijiFinlandFragile and conflict affected situationsFranceFrench PolynesiaGabonGambia, TheGeorgiaGermanyGhanaGreeceGrenadaGuatemalaGuineaGuinea-BissauGuyanaHaitiHeavily indebted poor countries (HIPC)High incomeHondurasHong Kong SAR, ChinaHungaryIBRD onlyIcelandIDA & IBRD totalIDA blendIDA onlyIDA totalIndiaIndonesiaIran, Islamic Rep.IraqIrelandIsraelItalyJamaicaJapanJordanKazakhstanKenyaKiribatiKorea, Rep.KosovoKuwaitKyrgyz RepublicLao PDRLate-demographic dividendLatin America & Caribbean Latin America & Caribbean (excluding high income)Latin America & the Caribbean (IDA & IBRD countries)LatviaLeast developed countries: UN classificationLebanonLesothoLiberiaLibyaLithuaniaLow & middle incomeLow incomeLower middle incomeLuxembourgMacao SAR, ChinaMacedonia, FYRMadagascarMalawiMalaysiaMaldivesMaliMaltaMauritaniaMauritiusMexicoMicronesia, Fed. Sts.Middle East & North AfricaMiddle East & North Africa (excluding high income)Middle East & North Africa (IDA & IBRD countries)Middle incomeMoldovaMongoliaMontenegroMoroccoMozambiqueMyanmarNamibiaNepalNetherlandsNew CaledoniaNew ZealandNicaraguaNigerNigeriaNorth AmericaNorwayOECD membersOmanOther small statesPacific island small statesPakistanPalauPanamaPapua New GuineaParaguayPeruPhilippinesPolandPortugalPost-demographic dividendPre-demographic dividendPuerto RicoQatarRomaniaRussian FederationRwandaSamoaSaudi ArabiaSenegalSerbiaSeychellesSierra LeoneSingaporeSlovak RepublicSloveniaSmall statesSolomon IslandsSomaliaSouth AfricaSouth AsiaSouth Asia (IDA & IBRD)South SudanSpainSri LankaSt. Kitts and NevisSt. LuciaSt. Vincent and the GrenadinesSub-Saharan Africa Sub-Saharan Africa (excluding high income)Sub-Saharan Africa (IDA & IBRD countries)SudanSurinameSwazilandSwedenSwitzerlandSyrian Arab RepublicTajikistanTanzaniaThailandTimor-LesteTogoTongaTrinidad and TobagoTunisiaTurkeyTurkmenistanUgandaUkraineUnited Arab EmiratesUnited KingdomUnited StatesUpper middle incomeUruguayUzbekistanVanuatuVenezuela, RBVietnamWest Bank and GazaWorldYemen, Rep.ZambiaZimbabwe Linea del tempo:
Questa scala temporale mostra un grafico dal 1961 anno al 2016 anno. Fiji. I dati fino ad 1960 anno non disponibili. Il numero di osservazioni attuali secondo i date: 56.
La fonte (nome):
Indicatori dello sviluppo mondiale
La fonte (organizzazione):
World Bank national accounts data, and OECD National Accounts data files.
Categorie:
Economy & Growth, Trade
sono stati aggiornati
23 apr 2017 anni
Indicatori delle variazioni dei valori per anni
Minima:
-18.011
1 gen 2007 anni
Massimo:
5.845
1 gen 1965 anni
Alla data di osservazione
Valore
Variazione assoluta
La variazione rispetto al valore precedente
1 gen 1961 anni
-1.794
-1.794
0.0%
1 gen 1962 anni
-10.118
-8.325
464.1%
1 gen 1963 anni
-3.176
+6.942
-68.61%
1 gen 1964 anni
2.432
+5.608
-176.57%
1 gen 1965 anni
5.845
+3.413
140.36%
1 gen 1966 anni
-7.877
-13.722
-234.75%
1 gen 1967 anni
-4.511
+3.365
-42.73%
1 gen 1968 anni
-2.676
+1.835
-40.69%
1 gen 1969 anni
-4.458
-1.782
66.61%
1 gen 1970 anni
-4.331
+0.127
-2.84%
1 gen 1971 anni
-3.233
+1.099
-25.37%
1 gen 1972 anni
-7.787
-4.554
140.89%
1 gen 1973 anni
-9.3
-1.513
19.43%
1 gen 1974 anni
-13.479
-4.18
44.94%
1 gen 1975 anni
-5.222
+8.257
-61.26%
1 gen 1976 anni
-0.64
+4.582
-87.74%
1 gen 1977 anni
-4.731
-4.091
639.15%
1 gen 1978 anni
-2.757
+1.974
-41.73%
1 gen 1979 anni
-4.415
-1.658
60.12%
1 gen 1980 anni
-5.433
-1.018
23.07%
1 gen 1981 anni
-4.941
+0.492
-9.06%
1 gen 1982 anni
-14.41
-9.47
191.67%
1 gen 1983 anni
-6.404
+8.006
-55.56%
1 gen 1984 anni
-5.428
+0.976
-15.24%
1 gen 1985 anni
-1.066
+4.362
-80.35%
1 gen 1986 anni
-0.38
+0.687
-64.39%
1 gen 1987 anni
2.189
+2.569
-676.44%
1 gen 1988 anni
3.276
+1.087
49.64%
1 gen 1989 anni
3.149
-0.127
-3.86%
1 gen 1990 anni
2.314
-0.835
-26.52%
1 gen 1991 anni
-4.813
-7.127
-307.97%
1 gen 1992 anni
-3.193
+1.62
-33.66%
1 gen 1993 anni
-2.997
+0.196
-6.14%
1 gen 1994 anni
-7.071
-4.074
135.94%
1 gen 1995 anni
-3.031
+4.04
-57.14%
1 gen 1996 anni
0.444
+3.475
-114.65%
1 gen 1997 anni
4.003
+3.559
801.71%
1 gen 1998 anni
2.6
-1.403
-35.04%
1 gen 1999 anni
2.5
-0.1
-3.84%
1 gen 2000 anni
-0.397
-2.898
-115.89%
1 gen 2001 anni
-5.105
-4.708
1.18 Mille.%
1 gen 2002 anni
-8.052
-2.947
57.72%
1 gen 2003 anni
-2.439
+5.612
-69.7%
1 gen 2004 anni
-8.379
-5.94
243.51%
1 gen 2005 anni
-16.601
-8.222
98.12%
1 gen 2006 anni
-11.99
+4.611
-27.78%
1 gen 2007 anni
-18.011
-6.021
50.22%
1 gen 2008 anni
-12.554
+5.457
-30.3%
1 gen 2009 anni
-16.439
-3.884
30.94%
1 gen 2010 anni
-10.237
+6.201
-37.72%
1 gen 2011 anni
-6.055
+4.182
-40.85%
1 gen 2012 anni
-5.633
+0.422
-6.97%
1 gen 2013 anni
-3.062
+2.571
-45.64%
1 gen 2014 anni
-12.815
-9.753
318.52%
1 gen 2015 anni
-8.055
+4.76
-37.15%
1 gen 2016 anni
-6.438
+1.617
-20.07%
Classificazione dei paesi secondo i statistiche attuali per anni


Commenti: