29
/it/
it
AIzaSyAYiBZKx7MnpbEhh9jyipgxe19OcubqV5w
April 1, 2024
277616
Uruguay
URY
true
2
1
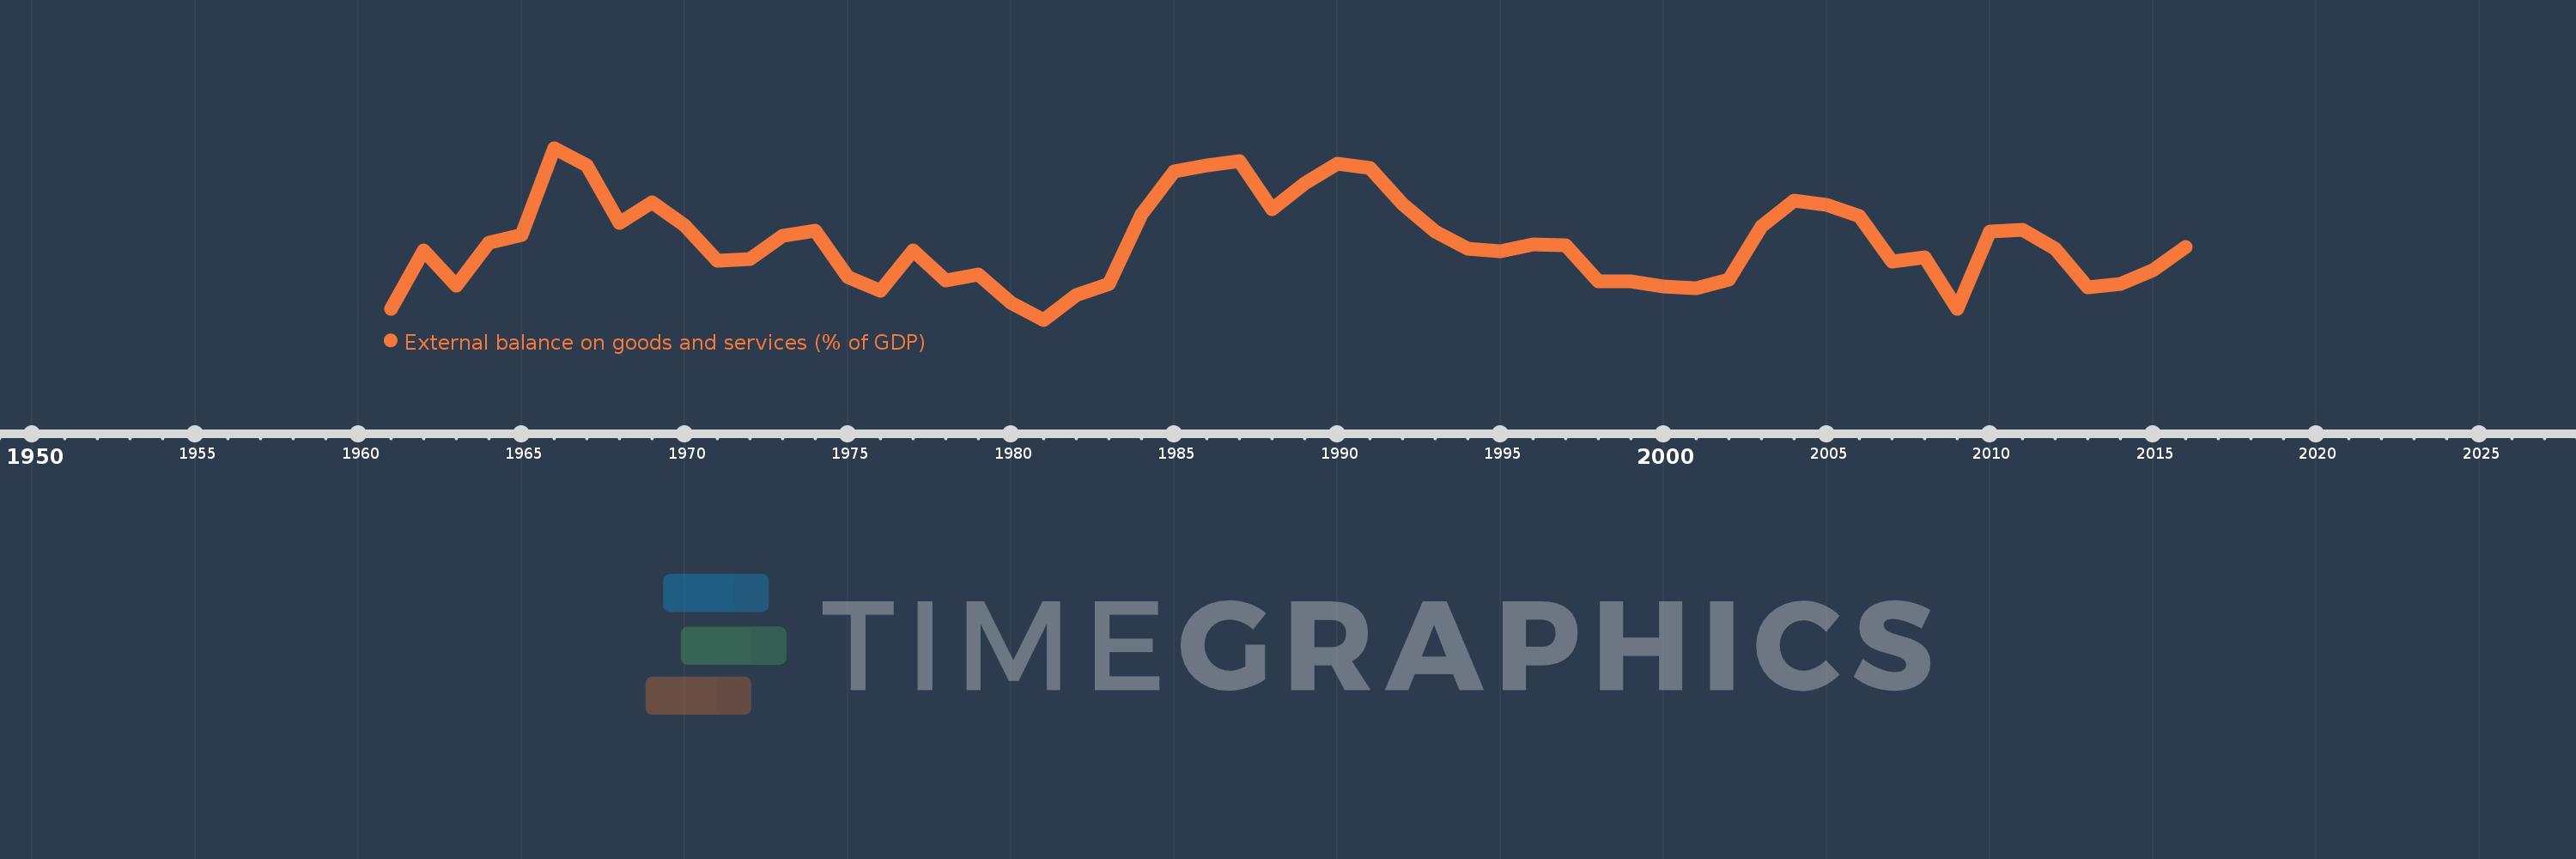
External balance on goods and services (% of GDP)
2016,2015,2014,2013,2012,2011,2010,2009,2008,2007,2006,2005,2004,2003,2002,2001,2000,1999,1998,1997,1996,1995,1994,1993,1992,1991,1990,1989,1988,1987,1986,1985,1984,1983,1982,1981,1980,1979,1978,1977,1976,1975,1974,1973,1972,1971,1970,1969,1968,1967,1966,1965,1964,1963,1962,1961
Queste statistiche in altri paesi:
AfghanistanAlbaniaAlgeriaAngolaAntigua and BarbudaArab WorldArgentinaArmeniaArubaAustraliaAustriaAzerbaijanBahamas, TheBahrainBangladeshBarbadosBelarusBelgiumBelizeBeninBermudaBhutanBoliviaBosnia and HerzegovinaBotswanaBrazilBrunei DarussalamBulgariaBurkina FasoBurundiCabo VerdeCambodiaCameroonCanadaCaribbean small statesCentral African RepublicCentral Europe and the BalticsChadChileChinaColombiaComorosCongo, Dem. Rep.Congo, Rep.Costa RicaCote d'IvoireCroatiaCubaCyprusCzech RepublicDenmarkDjiboutiDominicaDominican RepublicEarly-demographic dividendEast Asia & PacificEast Asia & Pacific (excluding high income)East Asia & Pacific (IDA & IBRD countries)EcuadorEgypt, Arab Rep.El SalvadorEquatorial GuineaEritreaEstoniaEthiopiaEuro areaEurope & Central AsiaEurope & Central Asia (excluding high income)Europe & Central Asia (IDA & IBRD countries)European UnionFaroe IslandsFijiFinlandFragile and conflict affected situationsFranceFrench PolynesiaGabonGambia, TheGeorgiaGermanyGhanaGreeceGrenadaGuatemalaGuineaGuinea-BissauGuyanaHaitiHeavily indebted poor countries (HIPC)High incomeHondurasHong Kong SAR, ChinaHungaryIBRD onlyIcelandIDA & IBRD totalIDA blendIDA onlyIDA totalIndiaIndonesiaIran, Islamic Rep.IraqIrelandIsraelItalyJamaicaJapanJordanKazakhstanKenyaKiribatiKorea, Rep.KosovoKuwaitKyrgyz RepublicLao PDRLate-demographic dividendLatin America & Caribbean Latin America & Caribbean (excluding high income)Latin America & the Caribbean (IDA & IBRD countries)LatviaLeast developed countries: UN classificationLebanonLesothoLiberiaLibyaLithuaniaLow & middle incomeLow incomeLower middle incomeLuxembourgMacao SAR, ChinaMacedonia, FYRMadagascarMalawiMalaysiaMaldivesMaliMaltaMauritaniaMauritiusMexicoMicronesia, Fed. Sts.Middle East & North AfricaMiddle East & North Africa (excluding high income)Middle East & North Africa (IDA & IBRD countries)Middle incomeMoldovaMongoliaMontenegroMoroccoMozambiqueMyanmarNamibiaNepalNetherlandsNew CaledoniaNew ZealandNicaraguaNigerNigeriaNorth AmericaNorwayOECD membersOmanOther small statesPacific island small statesPakistanPalauPanamaPapua New GuineaParaguayPeruPhilippinesPolandPortugalPost-demographic dividendPre-demographic dividendPuerto RicoQatarRomaniaRussian FederationRwandaSamoaSaudi ArabiaSenegalSerbiaSeychellesSierra LeoneSingaporeSlovak RepublicSloveniaSmall statesSolomon IslandsSomaliaSouth AfricaSouth AsiaSouth Asia (IDA & IBRD)South SudanSpainSri LankaSt. Kitts and NevisSt. LuciaSt. Vincent and the GrenadinesSub-Saharan Africa Sub-Saharan Africa (excluding high income)Sub-Saharan Africa (IDA & IBRD countries)SudanSurinameSwazilandSwedenSwitzerlandSyrian Arab RepublicTajikistanTanzaniaThailandTimor-LesteTogoTongaTrinidad and TobagoTunisiaTurkeyTurkmenistanUgandaUkraineUnited Arab EmiratesUnited KingdomUnited StatesUpper middle incomeUruguayUzbekistanVanuatuVenezuela, RBVietnamWest Bank and GazaWorldYemen, Rep.ZambiaZimbabwe Linea del tempo:
Questa scala temporale mostra un grafico dal 1961 anno al 2016 anno. Uruguay. I dati fino ad 1960 anno non disponibili. Il numero di osservazioni attuali secondo i date: 56.
La fonte (nome):
Indicatori dello sviluppo mondiale
La fonte (organizzazione):
World Bank national accounts data, and OECD National Accounts data files.
Categorie:
Economy & Growth, Trade
sono stati aggiornati
23 apr 2017 anni
Indicatori delle variazioni dei valori per anni
Minima:
-5.598
1 gen 1981 anni
Massimo:
6.922
1 gen 1966 anni
Alla data di osservazione
Valore
Variazione assoluta
La variazione rispetto al valore precedente
1 gen 1961 anni
-4.828
-4.828
0.0%
1 gen 1962 anni
-0.568
+4.259
-88.23%
1 gen 1963 anni
-3.093
-2.525
444.33%
1 gen 1964 anni
0.0
+3.093
-100.0%
1 gen 1965 anni
0.597
+0.597
%
1 gen 1966 anni
6.922
+6.325
1.06 Mille.%
1 gen 1967 anni
5.641
-1.281
-18.5%
1 gen 1968 anni
1.431
-4.21
-74.63%
1 gen 1969 anni
2.977
+1.546
108.02%
1 gen 1970 anni
1.267
-1.71
-57.43%
1 gen 1971 anni
-1.321
-2.588
-204.21%
1 gen 1972 anni
-1.149
+0.172
-13.0%
1 gen 1973 anni
0.542
+1.691
-147.17%
1 gen 1974 anni
0.912
+0.37
68.3%
1 gen 1975 anni
-2.509
-3.421
-374.98%
1 gen 1976 anni
-3.498
-0.989
39.42%
1 gen 1977 anni
-0.519
+2.978
-85.15%
1 gen 1978 anni
-2.762
-2.243
431.82%
1 gen 1979 anni
-2.308
+0.454
-16.45%
1 gen 1980 anni
-4.334
-2.026
87.81%
1 gen 1981 anni
-5.598
-1.265
29.18%
1 gen 1982 anni
-3.827
+1.771
-31.64%
1 gen 1983 anni
-2.965
+0.862
-22.53%
1 gen 1984 anni
2.085
+5.05
-170.32%
1 gen 1985 anni
5.205
+3.12
149.65%
1 gen 1986 anni
5.656
+0.451
8.67%
1 gen 1987 anni
5.946
+0.29
5.13%
1 gen 1988 anni
2.443
-3.504
-58.92%
1 gen 1989 anni
4.322
+1.879
76.93%
1 gen 1990 anni
5.794
+1.472
34.06%
1 gen 1991 anni
5.436
-0.358
-6.19%
1 gen 1992 anni
2.832
-2.603
-47.89%
1 gen 1993 anni
0.822
-2.01
-70.98%
1 gen 1994 anni
-0.433
-1.255
-152.66%
1 gen 1995 anni
-0.615
-0.182
42.1%
1 gen 1996 anni
-0.104
+0.511
-83.09%
1 gen 1997 anni
-0.188
-0.084
81.14%
1 gen 1998 anni
-2.791
-2.602
1.38 Mille.%
1 gen 1999 anni
-2.8
-0.009
0.34%
1 gen 2000 anni
-3.191
-0.391
13.96%
1 gen 2001 anni
-3.318
-0.126
3.96%
1 gen 2002 anni
-2.7
+0.617
-18.61%
1 gen 2003 anni
1.214
+3.914
-144.97%
1 gen 2004 anni
3.106
+1.891
155.76%
1 gen 2005 anni
2.748
-0.358
-11.52%
1 gen 2006 anni
1.93
-0.818
-29.75%
1 gen 2007 anni
-1.377
-3.307
-171.31%
1 gen 2008 anni
-1.029
+0.347
-25.21%
1 gen 2009 anni
-4.802
-3.773
366.46%
1 gen 2010 anni
0.804
+5.606
-116.74%
1 gen 2011 anni
0.987
+0.183
22.75%
1 gen 2012 anni
-0.403
-1.39
-140.81%
1 gen 2013 anni
-3.222
-2.819
700.0%
1 gen 2014 anni
-3.012
+0.21
-6.53%
1 gen 2015 anni
-2.002
+1.009
-33.51%
1 gen 2016 anni
-0.295
+1.707
-85.27%
Classificazione dei paesi secondo i statistiche attuali per anni


Commenti: