29
/it/
it
AIzaSyAYiBZKx7MnpbEhh9jyipgxe19OcubqV5w
April 1, 2024
277956
Uruguay
URY
true
2
1
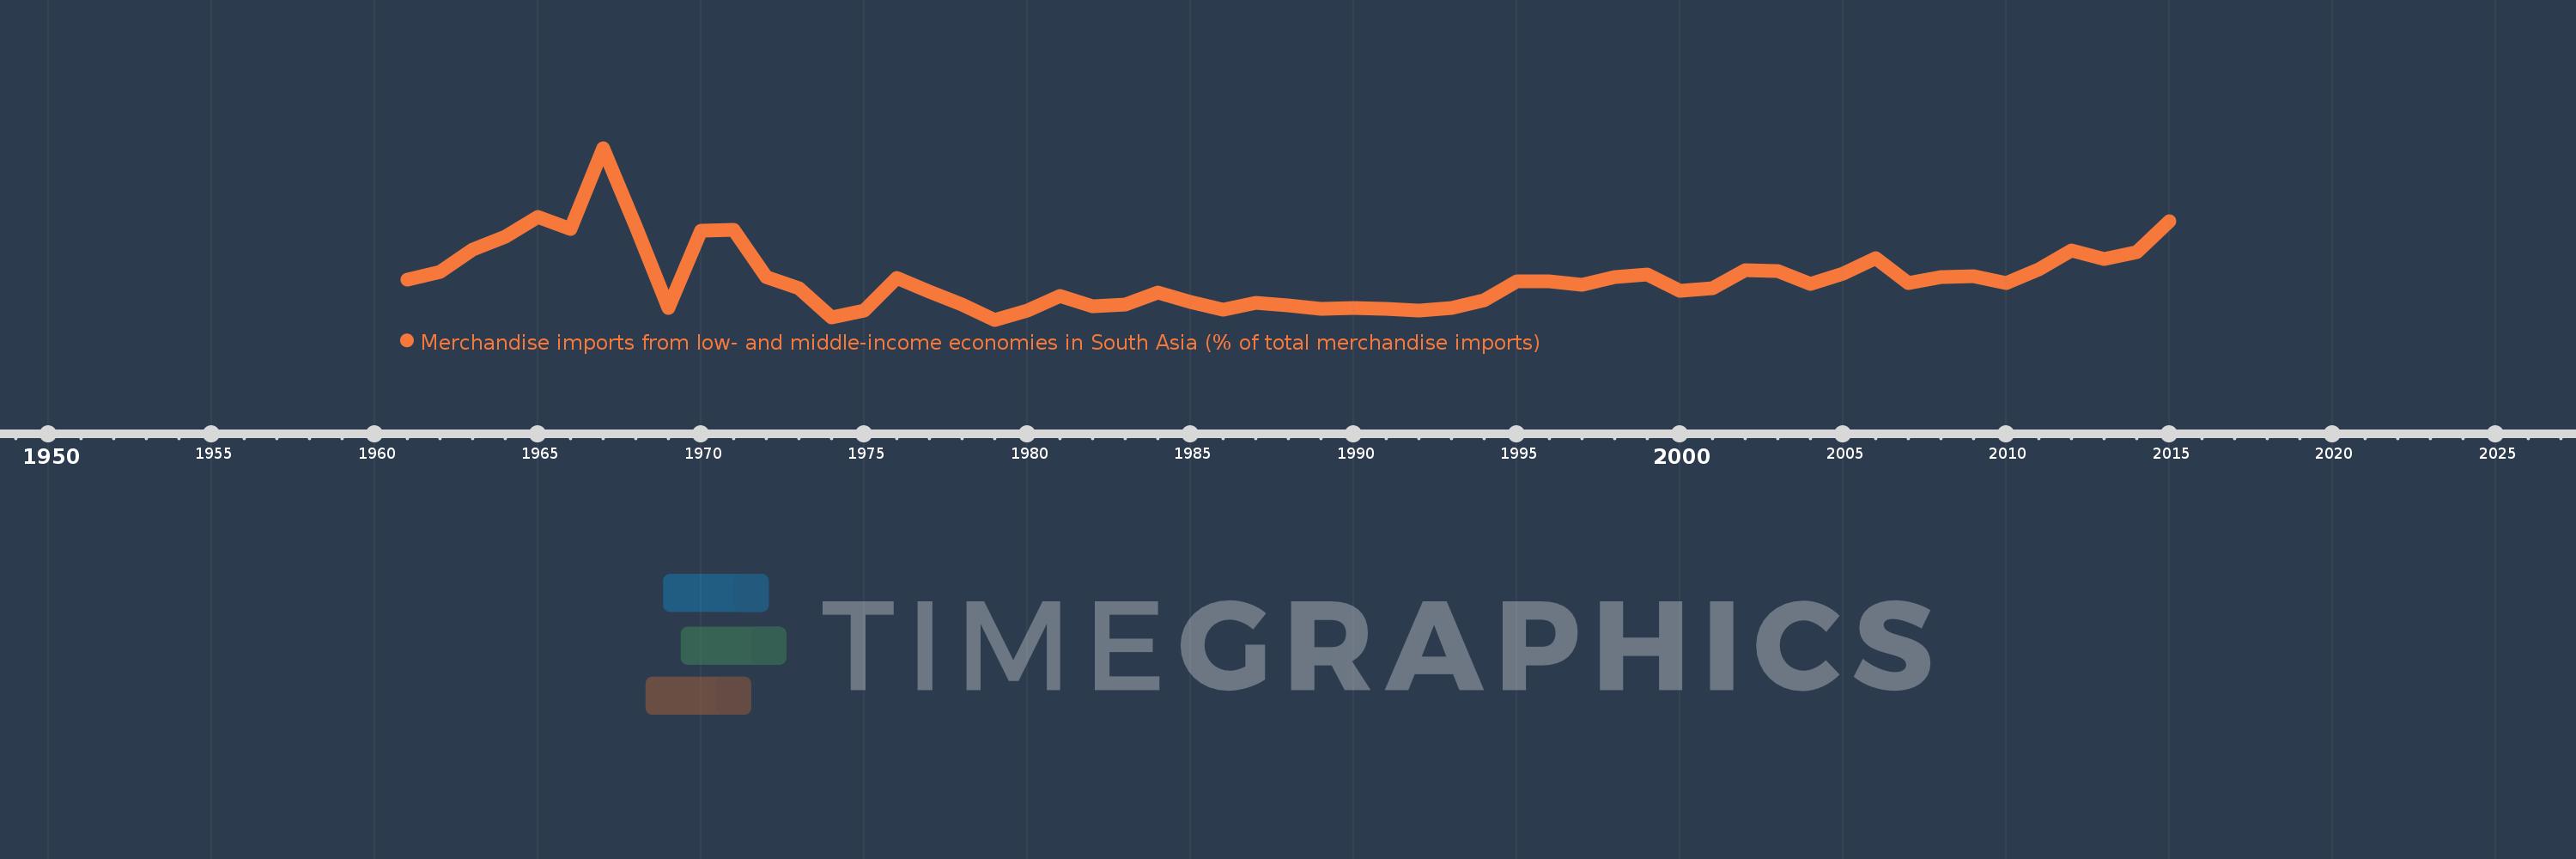
Merchandise imports from low- and middle-income economies in South Asia (% of total merchandise imports)
2015,2014,2013,2012,2011,2010,2009,2008,2007,2006,2005,2004,2003,2002,2001,2000,1999,1998,1997,1996,1995,1994,1993,1992,1991,1990,1989,1988,1987,1986,1985,1984,1983,1982,1981,1980,1979,1978,1977,1976,1975,1974,1973,1972,1971,1970,1969,1968,1967,1966,1965,1964,1963,1962,1961
Queste statistiche in altri paesi:
AfghanistanAlbaniaAlgeriaAngolaAntigua and BarbudaArab WorldArgentinaArmeniaArubaAustraliaAustriaAzerbaijanBahamas, TheBahrainBangladeshBarbadosBelarusBelgiumBelizeBeninBermudaBoliviaBrazilBrunei DarussalamBulgariaBurkina FasoBurundiCabo VerdeCambodiaCameroonCanadaCaribbean small statesCentral African RepublicCentral Europe and the BalticsChadChileChinaColombiaCongo, Dem. Rep.Congo, Rep.Costa RicaCote d'IvoireCroatiaCubaCyprusCzech RepublicDenmarkDjiboutiDominicaDominican RepublicEarly-demographic dividendEast Asia & PacificEast Asia & Pacific (excluding high income)East Asia & Pacific (IDA & IBRD countries)EcuadorEgypt, Arab Rep.El SalvadorEstoniaEthiopiaEuro areaEurope & Central AsiaEurope & Central Asia (excluding high income)Europe & Central Asia (IDA & IBRD countries)European UnionFaroe IslandsFijiFinlandFragile and conflict affected situationsFranceGabonGambia, TheGeorgiaGermanyGhanaGibraltarGreeceGreenlandGrenadaGuatemalaGuineaGuyanaHaitiHeavily indebted poor countries (HIPC)High incomeHondurasHong Kong SAR, ChinaHungaryIBRD onlyIcelandIDA & IBRD totalIDA blendIDA onlyIDA totalIndiaIndonesiaIran, Islamic Rep.IraqIrelandIsraelItalyJamaicaJapanJordanKazakhstanKenyaKiribatiKorea, Dem. People’s Rep.Korea, Rep.KosovoKuwaitKyrgyz RepublicLao PDRLate-demographic dividendLatin America & Caribbean Latin America & Caribbean (excluding high income)Latin America & the Caribbean (IDA & IBRD countries)LatviaLeast developed countries: UN classificationLebanonLiberiaLibyaLithuaniaLow & middle incomeLow incomeLower middle incomeLuxembourgMacao SAR, ChinaMacedonia, FYRMadagascarMalawiMalaysiaMaldivesMaliMaltaMauritaniaMauritiusMexicoMiddle East & North AfricaMiddle East & North Africa (excluding high income)Middle East & North Africa (IDA & IBRD countries)Middle incomeMoldovaMongoliaMontenegroMoroccoMozambiqueMyanmarNauruNepalNetherlandsNew CaledoniaNew ZealandNicaraguaNigerNigeriaNorth AmericaNorwayOECD membersOmanOther small statesPacific island small statesPakistanPanamaPapua New GuineaParaguayPeruPhilippinesPolandPortugalPost-demographic dividendPre-demographic dividendQatarRomaniaRussian FederationRwandaSamoaSaudi ArabiaSenegalSerbiaSeychellesSierra LeoneSingaporeSlovak RepublicSloveniaSmall statesSolomon IslandsSomaliaSouth AfricaSouth AsiaSouth Asia (IDA & IBRD)SpainSri LankaSt. Kitts and NevisSt. LuciaSt. Vincent and the GrenadinesSub-Saharan Africa Sub-Saharan Africa (excluding high income)Sub-Saharan Africa (IDA & IBRD countries)SudanSurinameSwedenSwitzerlandSyrian Arab RepublicTajikistanTanzaniaThailandTogoTongaTrinidad and TobagoTunisiaTurkeyTurkmenistanUgandaUkraineUnited Arab EmiratesUnited KingdomUnited StatesUpper middle incomeUruguayUzbekistanVanuatuVenezuela, RBVietnamWorldYemen, Rep.ZambiaZimbabwe Linea del tempo:
Questa scala temporale mostra un grafico dal 1961 anno al 2015 anno. Uruguay. I dati fino ad 1960 anno non disponibili. Il numero di osservazioni attuali secondo i date: 55.
La fonte (nome):
Indicatori dello sviluppo mondiale
La fonte (organizzazione):
World Bank staff estimates based data from International Monetary Fund's Direction of Trade database.
Categorie:
Private Sector, Trade
sono stati aggiornati
23 apr 2017 anni
Indicatori delle variazioni dei valori per anni
Minima:
0.128
1 gen 1979 anni
Massimo:
2.79
1 gen 1967 anni
Alla data di osservazione
Valore
Variazione assoluta
La variazione rispetto al valore precedente
1 gen 1961 anni
0.753
+0.753
0.0%
1 gen 1962 anni
0.864
+0.111
14.79%
1 gen 1963 anni
1.217
+0.353
40.88%
1 gen 1964 anni
1.413
+0.196
16.09%
1 gen 1965 anni
1.725
+0.312
22.06%
1 gen 1966 anni
1.534
-0.191
-11.05%
1 gen 1967 anni
2.79
+1.255
81.81%
1 gen 1968 anni
1.571
-1.219
-43.69%
1 gen 1969 anni
0.313
-1.258
-80.08%
1 gen 1970 anni
1.505
+1.192
381.0%
1 gen 1971 anni
1.524
+0.019
1.26%
1 gen 1972 anni
0.791
-0.733
-48.11%
1 gen 1973 anni
0.615
-0.176
-22.29%
1 gen 1974 anni
0.164
-0.451
-73.39%
1 gen 1975 anni
0.272
+0.108
66.26%
1 gen 1976 anni
0.777
+0.505
185.89%
1 gen 1977 anni
0.562
-0.215
-27.66%
1 gen 1978 anni
0.359
-0.203
-36.12%
1 gen 1979 anni
0.128
-0.232
-64.49%
1 gen 1980 anni
0.274
+0.147
115.05%
1 gen 1981 anni
0.495
+0.22
80.33%
1 gen 1982 anni
0.335
-0.16
-32.24%
1 gen 1983 anni
0.37
+0.035
10.45%
1 gen 1984 anni
0.553
+0.182
49.26%
1 gen 1985 anni
0.397
-0.156
-28.19%
1 gen 1986 anni
0.281
-0.116
-29.15%
1 gen 1987 anni
0.386
+0.105
37.2%
1 gen 1988 anni
0.346
-0.04
-10.31%
1 gen 1989 anni
0.295
-0.051
-14.62%
1 gen 1990 anni
0.314
+0.018
6.14%
1 gen 1991 anni
0.295
-0.019
-5.98%
1 gen 1992 anni
0.272
-0.023
-7.64%
1 gen 1993 anni
0.315
+0.042
15.58%
1 gen 1994 anni
0.43
+0.115
36.53%
1 gen 1995 anni
0.724
+0.294
68.47%
1 gen 1996 anni
0.726
+0.002
0.25%
1 gen 1997 anni
0.669
-0.057
-7.83%
1 gen 1998 anni
0.789
+0.12
17.97%
1 gen 1999 anni
0.828
+0.039
4.93%
1 gen 2000 anni
0.572
-0.256
-30.89%
1 gen 2001 anni
0.616
+0.044
7.74%
1 gen 2002 anni
0.897
+0.281
45.57%
1 gen 2003 anni
0.885
-0.013
-1.43%
1 gen 2004 anni
0.688
-0.197
-22.23%
1 gen 2005 anni
0.837
+0.149
21.71%
1 gen 2006 anni
1.077
+0.239
28.6%
1 gen 2007 anni
0.701
-0.376
-34.91%
1 gen 2008 anni
0.789
+0.089
12.64%
1 gen 2009 anni
0.809
+0.02
2.52%
1 gen 2010 anni
0.701
-0.109
-13.43%
1 gen 2011 anni
0.909
+0.208
29.67%
1 gen 2012 anni
1.205
+0.297
32.68%
1 gen 2013 anni
1.072
-0.134
-11.09%
1 gen 2014 anni
1.174
+0.102
9.51%
1 gen 2015 anni
1.654
+0.481
40.95%
Classificazione dei paesi secondo i statistiche attuali per anni


Commenti: