29
/it/
it
AIzaSyAYiBZKx7MnpbEhh9jyipgxe19OcubqV5w
April 1, 2024
140684
Ghana
GHA
true
2
1
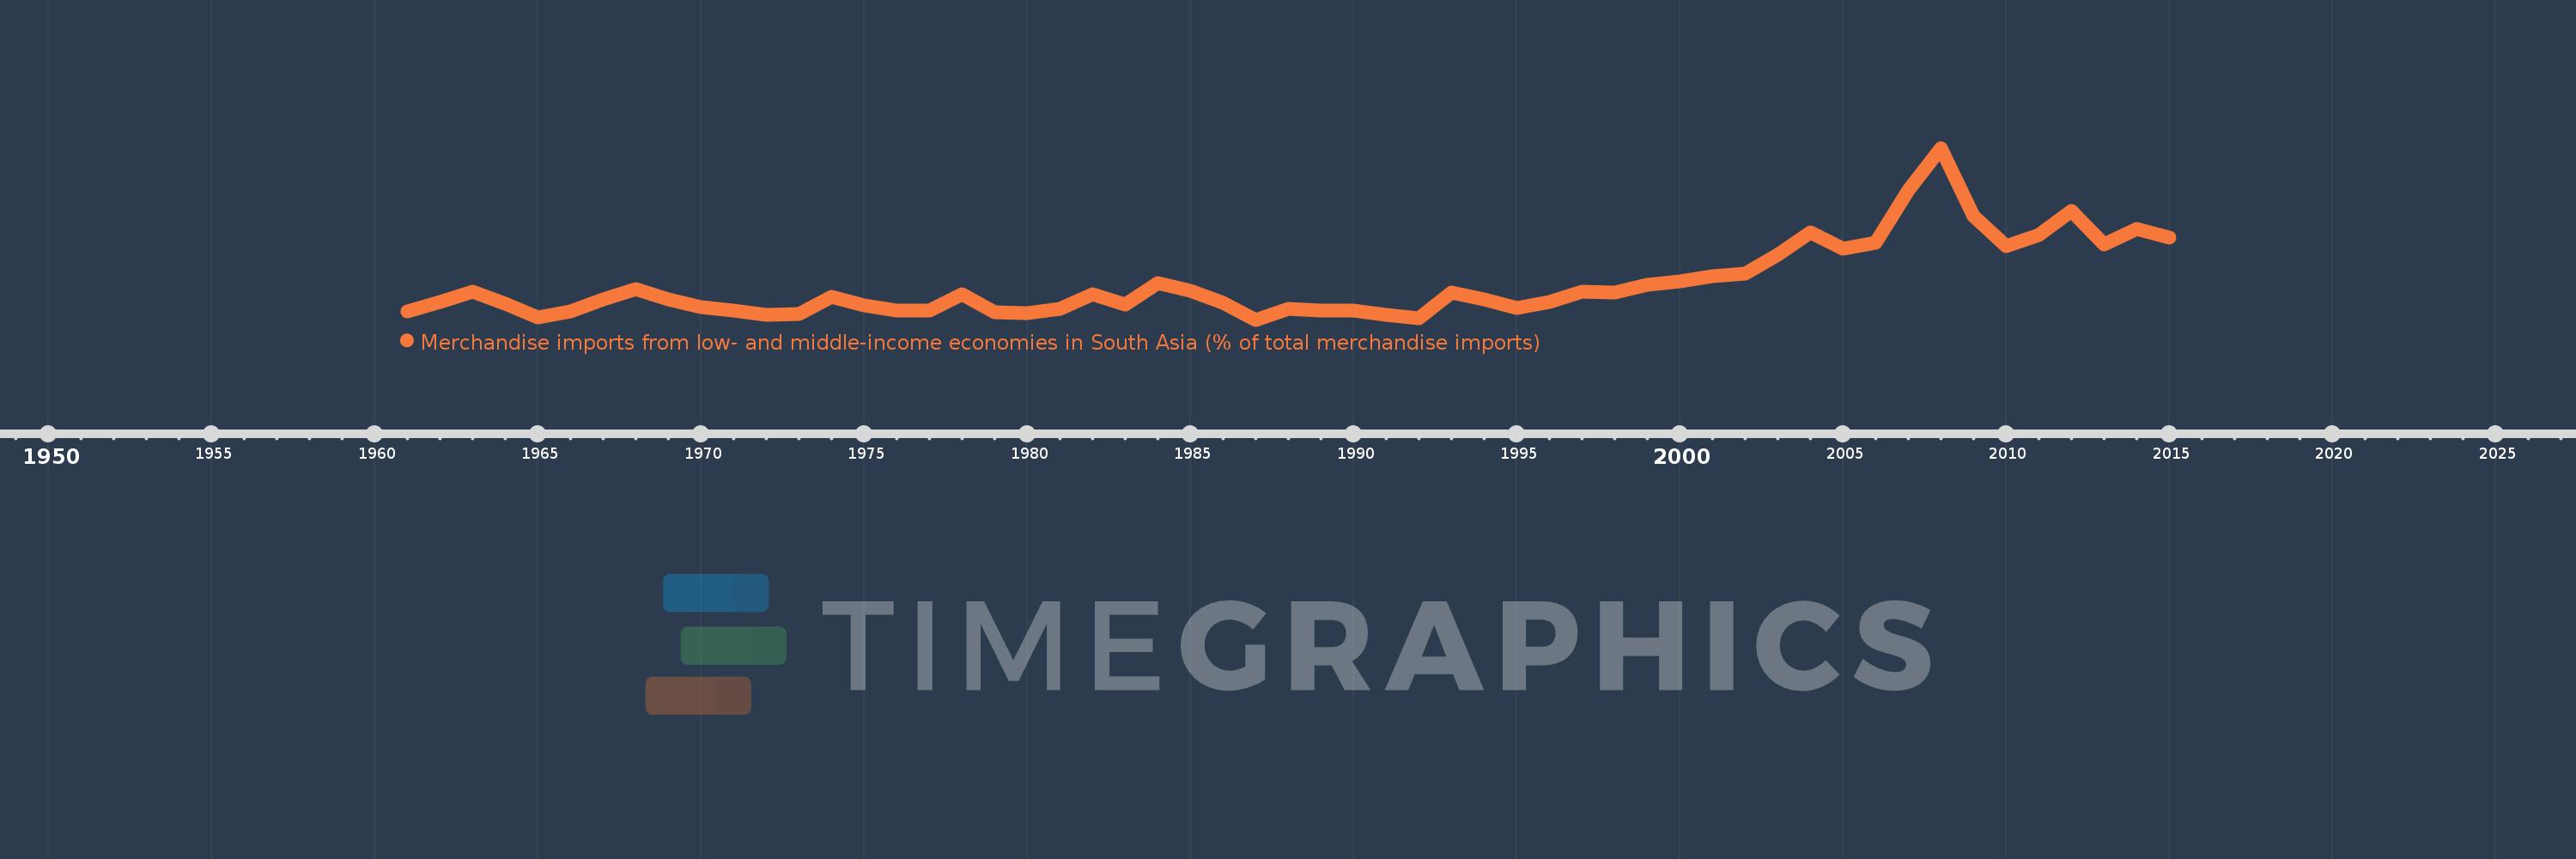
Merchandise imports from low- and middle-income economies in South Asia (% of total merchandise imports)
2015,2014,2013,2012,2011,2010,2009,2008,2007,2006,2005,2004,2003,2002,2001,2000,1999,1998,1997,1996,1995,1994,1993,1992,1991,1990,1989,1988,1987,1986,1985,1984,1983,1982,1981,1980,1979,1978,1977,1976,1975,1974,1973,1972,1971,1970,1969,1968,1967,1966,1965,1964,1963,1962,1961
Queste statistiche in altri paesi:
AfghanistanAlbaniaAlgeriaAngolaAntigua and BarbudaArab WorldArgentinaArmeniaArubaAustraliaAustriaAzerbaijanBahamas, TheBahrainBangladeshBarbadosBelarusBelgiumBelizeBeninBermudaBoliviaBrazilBrunei DarussalamBulgariaBurkina FasoBurundiCabo VerdeCambodiaCameroonCanadaCaribbean small statesCentral African RepublicCentral Europe and the BalticsChadChileChinaColombiaCongo, Dem. Rep.Congo, Rep.Costa RicaCote d'IvoireCroatiaCubaCyprusCzech RepublicDenmarkDjiboutiDominicaDominican RepublicEarly-demographic dividendEast Asia & PacificEast Asia & Pacific (excluding high income)East Asia & Pacific (IDA & IBRD countries)EcuadorEgypt, Arab Rep.El SalvadorEstoniaEthiopiaEuro areaEurope & Central AsiaEurope & Central Asia (excluding high income)Europe & Central Asia (IDA & IBRD countries)European UnionFaroe IslandsFijiFinlandFragile and conflict affected situationsFranceGabonGambia, TheGeorgiaGermanyGhanaGibraltarGreeceGreenlandGrenadaGuatemalaGuineaGuyanaHaitiHeavily indebted poor countries (HIPC)High incomeHondurasHong Kong SAR, ChinaHungaryIBRD onlyIcelandIDA & IBRD totalIDA blendIDA onlyIDA totalIndiaIndonesiaIran, Islamic Rep.IraqIrelandIsraelItalyJamaicaJapanJordanKazakhstanKenyaKiribatiKorea, Dem. People’s Rep.Korea, Rep.KosovoKuwaitKyrgyz RepublicLao PDRLate-demographic dividendLatin America & Caribbean Latin America & Caribbean (excluding high income)Latin America & the Caribbean (IDA & IBRD countries)LatviaLeast developed countries: UN classificationLebanonLiberiaLibyaLithuaniaLow & middle incomeLow incomeLower middle incomeLuxembourgMacao SAR, ChinaMacedonia, FYRMadagascarMalawiMalaysiaMaldivesMaliMaltaMauritaniaMauritiusMexicoMiddle East & North AfricaMiddle East & North Africa (excluding high income)Middle East & North Africa (IDA & IBRD countries)Middle incomeMoldovaMongoliaMontenegroMoroccoMozambiqueMyanmarNauruNepalNetherlandsNew CaledoniaNew ZealandNicaraguaNigerNigeriaNorth AmericaNorwayOECD membersOmanOther small statesPacific island small statesPakistanPanamaPapua New GuineaParaguayPeruPhilippinesPolandPortugalPost-demographic dividendPre-demographic dividendQatarRomaniaRussian FederationRwandaSamoaSaudi ArabiaSenegalSerbiaSeychellesSierra LeoneSingaporeSlovak RepublicSloveniaSmall statesSolomon IslandsSomaliaSouth AfricaSouth AsiaSouth Asia (IDA & IBRD)SpainSri LankaSt. Kitts and NevisSt. LuciaSt. Vincent and the GrenadinesSub-Saharan Africa Sub-Saharan Africa (excluding high income)Sub-Saharan Africa (IDA & IBRD countries)SudanSurinameSwedenSwitzerlandSyrian Arab RepublicTajikistanTanzaniaThailandTogoTongaTrinidad and TobagoTunisiaTurkeyTurkmenistanUgandaUkraineUnited Arab EmiratesUnited KingdomUnited StatesUpper middle incomeUruguayUzbekistanVanuatuVenezuela, RBVietnamWorldYemen, Rep.ZambiaZimbabwe Linea del tempo:
Questa scala temporale mostra un grafico dal 1961 anno al 2015 anno. Ghana. I dati fino ad 1960 anno non disponibili. Il numero di osservazioni attuali secondo i date: 55.
La fonte (nome):
Indicatori dello sviluppo mondiale
La fonte (organizzazione):
World Bank staff estimates based data from International Monetary Fund's Direction of Trade database.
Categorie:
Private Sector, Trade
sono stati aggiornati
23 apr 2017 anni
Indicatori delle variazioni dei valori per anni
Minima:
0.409
1 gen 1987 anni
Massimo:
8.945
1 gen 2008 anni
Alla data di osservazione
Valore
Variazione assoluta
La variazione rispetto al valore precedente
1 gen 1961 anni
0.829
+0.829
0.0%
1 gen 1962 anni
1.279
+0.45
54.36%
1 gen 1963 anni
1.801
+0.522
40.81%
1 gen 1964 anni
1.208
-0.593
-32.91%
1 gen 1965 anni
0.529
-0.679
-56.2%
1 gen 1966 anni
0.804
+0.274
51.87%
1 gen 1967 anni
1.423
+0.62
77.12%
1 gen 1968 anni
1.94
+0.517
36.32%
1 gen 1969 anni
1.404
-0.536
-27.64%
1 gen 1970 anni
1.044
-0.36
-25.67%
1 gen 1971 anni
0.874
-0.169
-16.21%
1 gen 1972 anni
0.64
-0.234
-26.77%
1 gen 1973 anni
0.69
+0.05
7.79%
1 gen 1974 anni
1.533
+0.843
122.12%
1 gen 1975 anni
1.108
-0.425
-27.72%
1 gen 1976 anni
0.872
-0.236
-21.32%
1 gen 1977 anni
0.869
-0.003
-0.32%
1 gen 1978 anni
1.697
+0.828
95.23%
1 gen 1979 anni
0.765
-0.932
-54.91%
1 gen 1980 anni
0.729
-0.036
-4.68%
1 gen 1981 anni
0.934
+0.205
28.09%
1 gen 1982 anni
1.692
+0.758
81.14%
1 gen 1983 anni
1.16
-0.532
-31.46%
1 gen 1984 anni
2.248
+1.088
93.86%
1 gen 1985 anni
1.857
-0.391
-17.41%
1 gen 1986 anni
1.236
-0.621
-33.44%
1 gen 1987 anni
0.409
-0.827
-66.92%
1 gen 1988 anni
0.945
+0.536
131.1%
1 gen 1989 anni
0.882
-0.062
-6.61%
1 gen 1990 anni
0.882
0.0
0.0%
1 gen 1991 anni
0.657
-0.225
-25.54%
1 gen 1992 anni
0.467
-0.19
-28.92%
1 gen 1993 anni
1.741
+1.274
272.8%
1 gen 1994 anni
1.408
-0.333
-19.12%
1 gen 1995 anni
0.977
-0.431
-30.64%
1 gen 1996 anni
1.291
+0.315
32.2%
1 gen 1997 anni
1.788
+0.497
38.45%
1 gen 1998 anni
1.741
-0.047
-2.6%
1 gen 1999 anni
2.151
+0.41
23.55%
1 gen 2000 anni
2.334
+0.183
8.49%
1 gen 2001 anni
2.563
+0.229
9.8%
1 gen 2002 anni
2.709
+0.146
5.68%
1 gen 2003 anni
3.659
+0.95
35.08%
1 gen 2004 anni
4.751
+1.093
29.86%
1 gen 2005 anni
3.923
-0.828
-17.43%
1 gen 2006 anni
4.237
+0.314
8.0%
1 gen 2007 anni
6.83
+2.593
61.19%
1 gen 2008 anni
8.945
+2.115
30.96%
1 gen 2009 anni
5.543
-3.402
-38.04%
1 gen 2010 anni
4.066
-1.477
-26.65%
1 gen 2011 anni
4.61
+0.544
13.39%
1 gen 2012 anni
5.801
+1.191
25.84%
1 gen 2013 anni
4.137
-1.664
-28.68%
1 gen 2014 anni
4.936
+0.798
19.29%
1 gen 2015 anni
4.485
-0.451
-9.13%
Classificazione dei paesi secondo i statistiche attuali per anni


Commenti: