29
/it/
it
AIzaSyAYiBZKx7MnpbEhh9jyipgxe19OcubqV5w
April 1, 2024
143214
Grenada
GRD
true
2
1
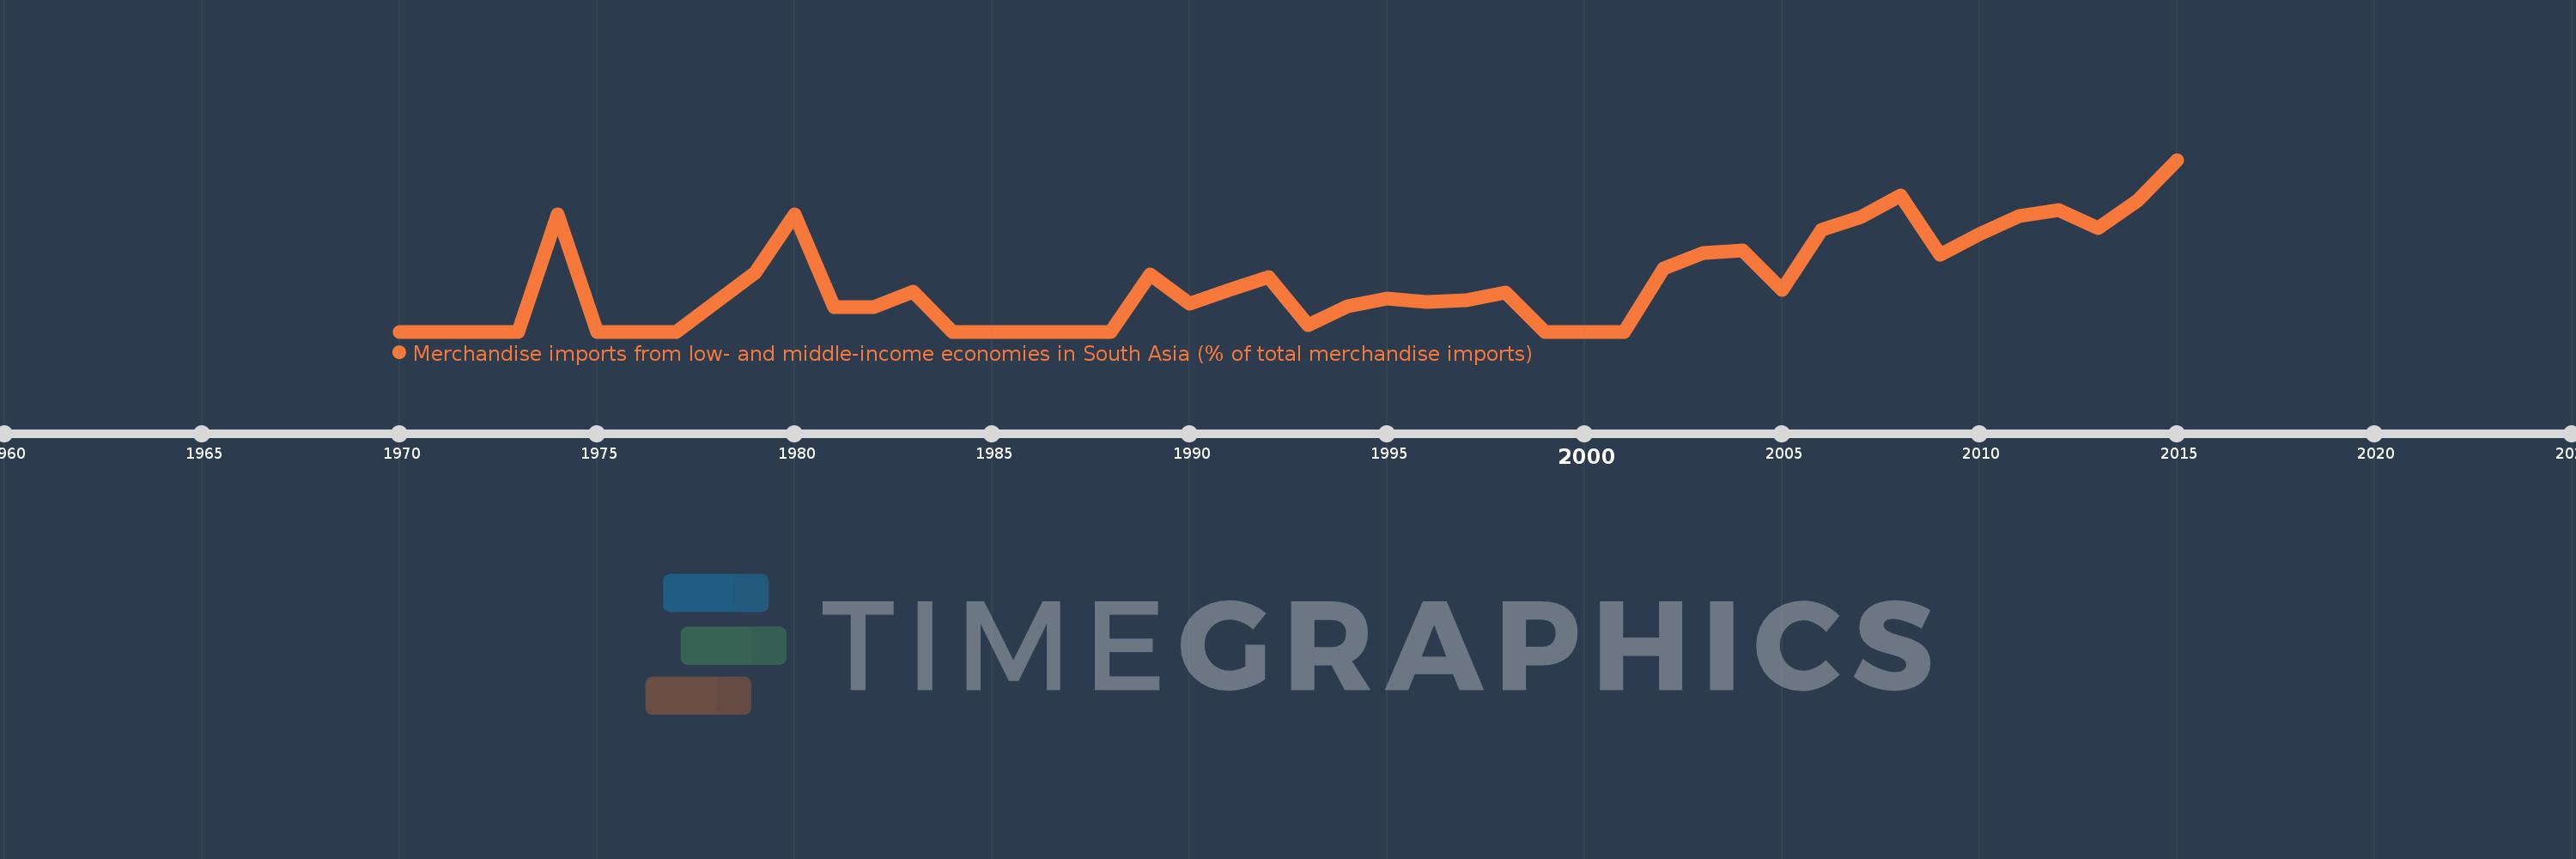
Merchandise imports from low- and middle-income economies in South Asia (% of total merchandise imports)
2015,2014,2013,2012,2011,2010,2009,2008,2007,2006,2005,2004,2003,2002,2001,2000,1999,1998,1997,1996,1995,1994,1993,1992,1991,1990,1989,1988,1987,1986,1985,1984,1983,1982,1981,1980,1979,1977,1976,1975,1974,1973,1972,1971,1970
Queste statistiche in altri paesi:
AfghanistanAlbaniaAlgeriaAngolaAntigua and BarbudaArab WorldArgentinaArmeniaArubaAustraliaAustriaAzerbaijanBahamas, TheBahrainBangladeshBarbadosBelarusBelgiumBelizeBeninBermudaBoliviaBrazilBrunei DarussalamBulgariaBurkina FasoBurundiCabo VerdeCambodiaCameroonCanadaCaribbean small statesCentral African RepublicCentral Europe and the BalticsChadChileChinaColombiaCongo, Dem. Rep.Congo, Rep.Costa RicaCote d'IvoireCroatiaCubaCyprusCzech RepublicDenmarkDjiboutiDominicaDominican RepublicEarly-demographic dividendEast Asia & PacificEast Asia & Pacific (excluding high income)East Asia & Pacific (IDA & IBRD countries)EcuadorEgypt, Arab Rep.El SalvadorEstoniaEthiopiaEuro areaEurope & Central AsiaEurope & Central Asia (excluding high income)Europe & Central Asia (IDA & IBRD countries)European UnionFaroe IslandsFijiFinlandFragile and conflict affected situationsFranceGabonGambia, TheGeorgiaGermanyGhanaGibraltarGreeceGreenlandGrenadaGuatemalaGuineaGuyanaHaitiHeavily indebted poor countries (HIPC)High incomeHondurasHong Kong SAR, ChinaHungaryIBRD onlyIcelandIDA & IBRD totalIDA blendIDA onlyIDA totalIndiaIndonesiaIran, Islamic Rep.IraqIrelandIsraelItalyJamaicaJapanJordanKazakhstanKenyaKiribatiKorea, Dem. People’s Rep.Korea, Rep.KosovoKuwaitKyrgyz RepublicLao PDRLate-demographic dividendLatin America & Caribbean Latin America & Caribbean (excluding high income)Latin America & the Caribbean (IDA & IBRD countries)LatviaLeast developed countries: UN classificationLebanonLiberiaLibyaLithuaniaLow & middle incomeLow incomeLower middle incomeLuxembourgMacao SAR, ChinaMacedonia, FYRMadagascarMalawiMalaysiaMaldivesMaliMaltaMauritaniaMauritiusMexicoMiddle East & North AfricaMiddle East & North Africa (excluding high income)Middle East & North Africa (IDA & IBRD countries)Middle incomeMoldovaMongoliaMontenegroMoroccoMozambiqueMyanmarNauruNepalNetherlandsNew CaledoniaNew ZealandNicaraguaNigerNigeriaNorth AmericaNorwayOECD membersOmanOther small statesPacific island small statesPakistanPanamaPapua New GuineaParaguayPeruPhilippinesPolandPortugalPost-demographic dividendPre-demographic dividendQatarRomaniaRussian FederationRwandaSamoaSaudi ArabiaSenegalSerbiaSeychellesSierra LeoneSingaporeSlovak RepublicSloveniaSmall statesSolomon IslandsSomaliaSouth AfricaSouth AsiaSouth Asia (IDA & IBRD)SpainSri LankaSt. Kitts and NevisSt. LuciaSt. Vincent and the GrenadinesSub-Saharan Africa Sub-Saharan Africa (excluding high income)Sub-Saharan Africa (IDA & IBRD countries)SudanSurinameSwedenSwitzerlandSyrian Arab RepublicTajikistanTanzaniaThailandTogoTongaTrinidad and TobagoTunisiaTurkeyTurkmenistanUgandaUkraineUnited Arab EmiratesUnited KingdomUnited StatesUpper middle incomeUruguayUzbekistanVanuatuVenezuela, RBVietnamWorldYemen, Rep.ZambiaZimbabwe Linea del tempo:
Questa scala temporale mostra un grafico dal 1970 anno al 2015 anno. Grenada. I dati fino ad 1969 anno non disponibili. Il numero di osservazioni attuali secondo i date: 45.
La fonte (nome):
Indicatori dello sviluppo mondiale
La fonte (organizzazione):
World Bank staff estimates based data from International Monetary Fund's Direction of Trade database.
Categorie:
Private Sector, Trade
sono stati aggiornati
23 apr 2017 anni
Indicatori delle variazioni dei valori per anni
Minima:
0.0
1 gen 1970 anni
Massimo:
0.535
1 gen 2015 anni
Alla data di osservazione
Valore
Variazione assoluta
La variazione rispetto al valore precedente
1 gen 1970 anni
0.0
0.0
0.0%
1 gen 1974 anni
0.366
+0.366
%
1 gen 1975 anni
0.0
-0.366
-100.0%
1 gen 1979 anni
0.182
+0.182
%
1 gen 1980 anni
0.365
+0.183
100.61%
1 gen 1981 anni
0.075
-0.29
-79.54%
1 gen 1982 anni
0.077
+0.003
3.6%
1 gen 1983 anni
0.125
+0.048
61.6%
1 gen 1984 anni
0.0
-0.125
-100.0%
1 gen 1989 anni
0.177
+0.177
%
1 gen 1990 anni
0.086
-0.092
-51.75%
1 gen 1991 anni
0.131
+0.046
53.24%
1 gen 1992 anni
0.171
+0.04
30.79%
1 gen 1993 anni
0.02
-0.152
-88.55%
1 gen 1994 anni
0.078
+0.058
297.02%
1 gen 1995 anni
0.102
+0.025
31.53%
1 gen 1996 anni
0.093
-0.01
-9.52%
1 gen 1997 anni
0.098
+0.005
5.69%
1 gen 1998 anni
0.121
+0.023
23.81%
1 gen 1999 anni
0.0
-0.121
-100.0%
1 gen 2002 anni
0.196
+0.196
%
1 gen 2003 anni
0.245
+0.048
24.54%
1 gen 2004 anni
0.254
+0.01
3.98%
1 gen 2005 anni
0.13
-0.124
-48.83%
1 gen 2006 anni
0.316
+0.186
142.73%
1 gen 2007 anni
0.357
+0.042
13.14%
1 gen 2008 anni
0.425
+0.068
18.94%
1 gen 2009 anni
0.24
-0.185
-43.51%
1 gen 2010 anni
0.304
+0.064
26.69%
1 gen 2011 anni
0.361
+0.057
18.73%
1 gen 2012 anni
0.379
+0.018
4.85%
1 gen 2013 anni
0.323
-0.056
-14.72%
1 gen 2014 anni
0.408
+0.085
26.31%
1 gen 2015 anni
0.535
+0.127
31.16%
Classificazione dei paesi secondo i statistiche attuali per anni


Commenti: