29
/it/
it
AIzaSyAYiBZKx7MnpbEhh9jyipgxe19OcubqV5w
April 1, 2024
27477
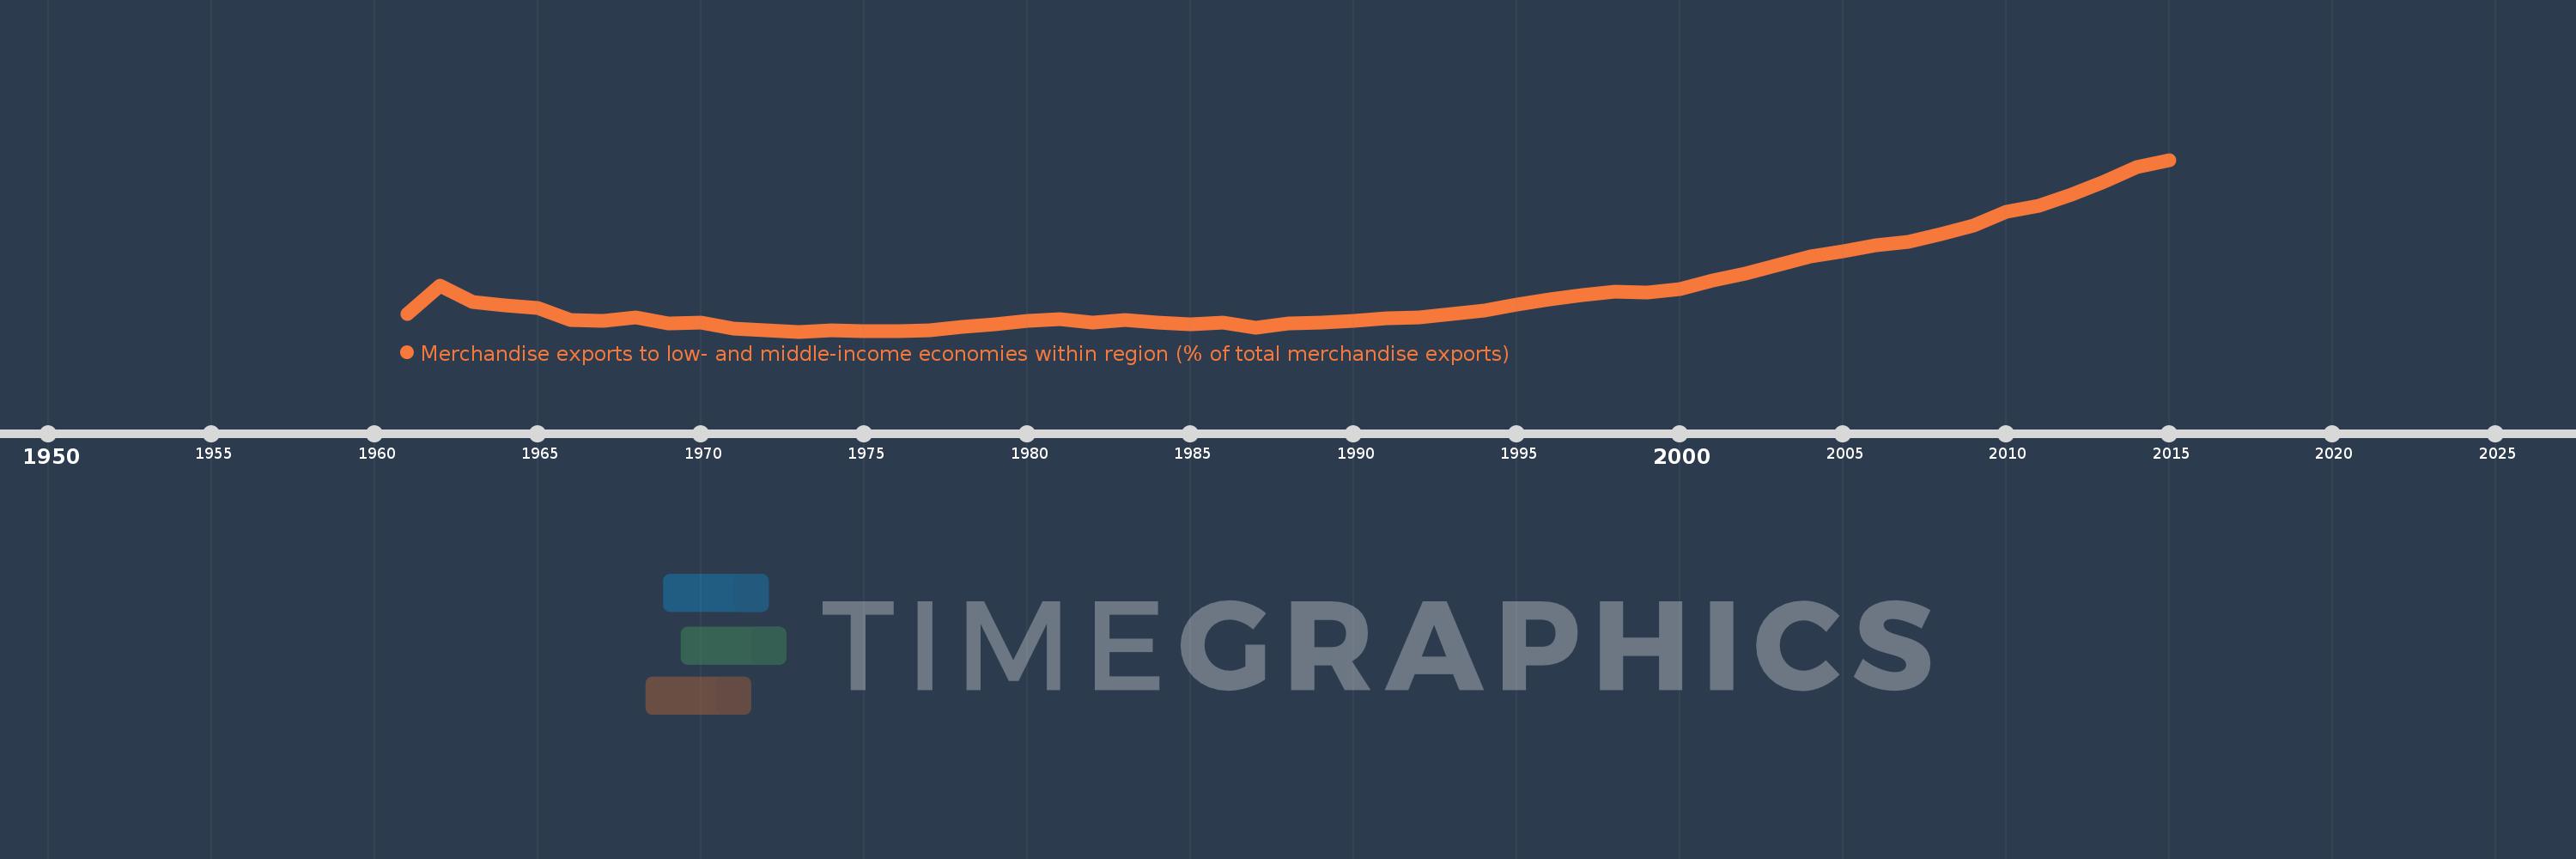
East Asia & Pacific
EAS
false
2
1
Merchandise exports to low- and middle-income economies within region (% of total merchandise exports)
2015,2014,2013,2012,2011,2010,2009,2008,2007,2006,2005,2004,2003,2002,2001,2000,1999,1998,1997,1996,1995,1994,1993,1992,1991,1990,1989,1988,1987,1986,1985,1984,1983,1982,1981,1980,1979,1978,1977,1976,1975,1974,1973,1972,1971,1970,1969,1968,1967,1966,1965,1964,1963,1962,1961
Queste statistiche in altri paesi:
Linea del tempo:
Questa scala temporale mostra un grafico dal 1961 anno al 2015 anno. East Asia & Pacific. I dati fino ad 1960 anno non disponibili. Il numero di osservazioni attuali secondo i date: 55.
La fonte (nome):
Indicatori dello sviluppo mondiale
La fonte (organizzazione):
World Bank staff estimates based data from International Monetary Fund's Direction of Trade database.
Categorie:
Private Sector, Trade
sono stati aggiornati
23 apr 2017 anni
Indicatori delle variazioni dei valori per anni
Minima:
0.589
1 gen 1973 anni
Massimo:
7.863
1 gen 2015 anni
Alla data di osservazione
Valore
Variazione assoluta
La variazione rispetto al valore precedente
1 gen 1961 anni
1.328
+1.328
0.0%
1 gen 1962 anni
2.529
+1.201
90.49%
1 gen 1963 anni
1.86
-0.669
-26.44%
1 gen 1964 anni
1.687
-0.173
-9.3%
1 gen 1965 anni
1.601
-0.086
-5.09%
1 gen 1966 anni
1.072
-0.53
-33.07%
1 gen 1967 anni
1.059
-0.013
-1.21%
1 gen 1968 anni
1.195
+0.136
12.89%
1 gen 1969 anni
0.951
-0.244
-20.41%
1 gen 1970 anni
0.977
+0.026
2.73%
1 gen 1971 anni
0.723
-0.254
-25.96%
1 gen 1972 anni
0.661
-0.062
-8.61%
1 gen 1973 anni
0.589
-0.072
-10.85%
1 gen 1974 anni
0.626
+0.036
6.12%
1 gen 1975 anni
0.617
-0.008
-1.32%
1 gen 1976 anni
0.593
-0.024
-3.95%
1 gen 1977 anni
0.658
+0.065
10.91%
1 gen 1978 anni
0.778
+0.12
18.26%
1 gen 1979 anni
0.884
+0.106
13.68%
1 gen 1980 anni
1.031
+0.147
16.65%
1 gen 1981 anni
1.102
+0.07
6.82%
1 gen 1982 anni
0.988
-0.113
-10.3%
1 gen 1983 anni
1.08
+0.092
9.3%
1 gen 1984 anni
0.959
-0.121
-11.24%
1 gen 1985 anni
0.908
-0.051
-5.29%
1 gen 1986 anni
0.974
+0.066
7.23%
1 gen 1987 anni
0.765
-0.209
-21.47%
1 gen 1988 anni
0.937
+0.173
22.58%
1 gen 1989 anni
0.962
+0.025
2.66%
1 gen 1990 anni
1.041
+0.079
8.23%
1 gen 1991 anni
1.153
+0.111
10.71%
1 gen 1992 anni
1.205
+0.052
4.49%
1 gen 1993 anni
1.323
+0.119
9.85%
1 gen 1994 anni
1.464
+0.141
10.63%
1 gen 1995 anni
1.724
+0.26
17.77%
1 gen 1996 anni
1.971
+0.247
14.33%
1 gen 1997 anni
2.123
+0.152
7.71%
1 gen 1998 anni
2.295
+0.172
8.09%
1 gen 1999 anni
2.255
-0.04
-1.73%
1 gen 2000 anni
2.405
+0.15
6.65%
1 gen 2001 anni
2.739
+0.334
13.88%
1 gen 2002 anni
3.051
+0.312
11.4%
1 gen 2003 anni
3.422
+0.371
12.17%
1 gen 2004 anni
3.778
+0.356
10.4%
1 gen 2005 anni
3.974
+0.197
5.21%
1 gen 2006 anni
4.24
+0.266
6.68%
1 gen 2007 anni
4.373
+0.133
3.13%
1 gen 2008 anni
4.724
+0.351
8.03%
1 gen 2009 anni
5.074
+0.35
7.4%
1 gen 2010 anni
5.662
+0.588
11.6%
1 gen 2011 anni
5.929
+0.268
4.73%
1 gen 2012 anni
6.39
+0.461
7.77%
1 gen 2013 anni
6.936
+0.546
8.55%
1 gen 2014 anni
7.563
+0.626
9.03%
1 gen 2015 anni
7.863
+0.3
3.97%
Classificazione dei paesi secondo i statistiche attuali per anni


Commenti: