29
/it/
it
AIzaSyAYiBZKx7MnpbEhh9jyipgxe19OcubqV5w
April 1, 2024
195846
Mexico
MEX
true
2
1
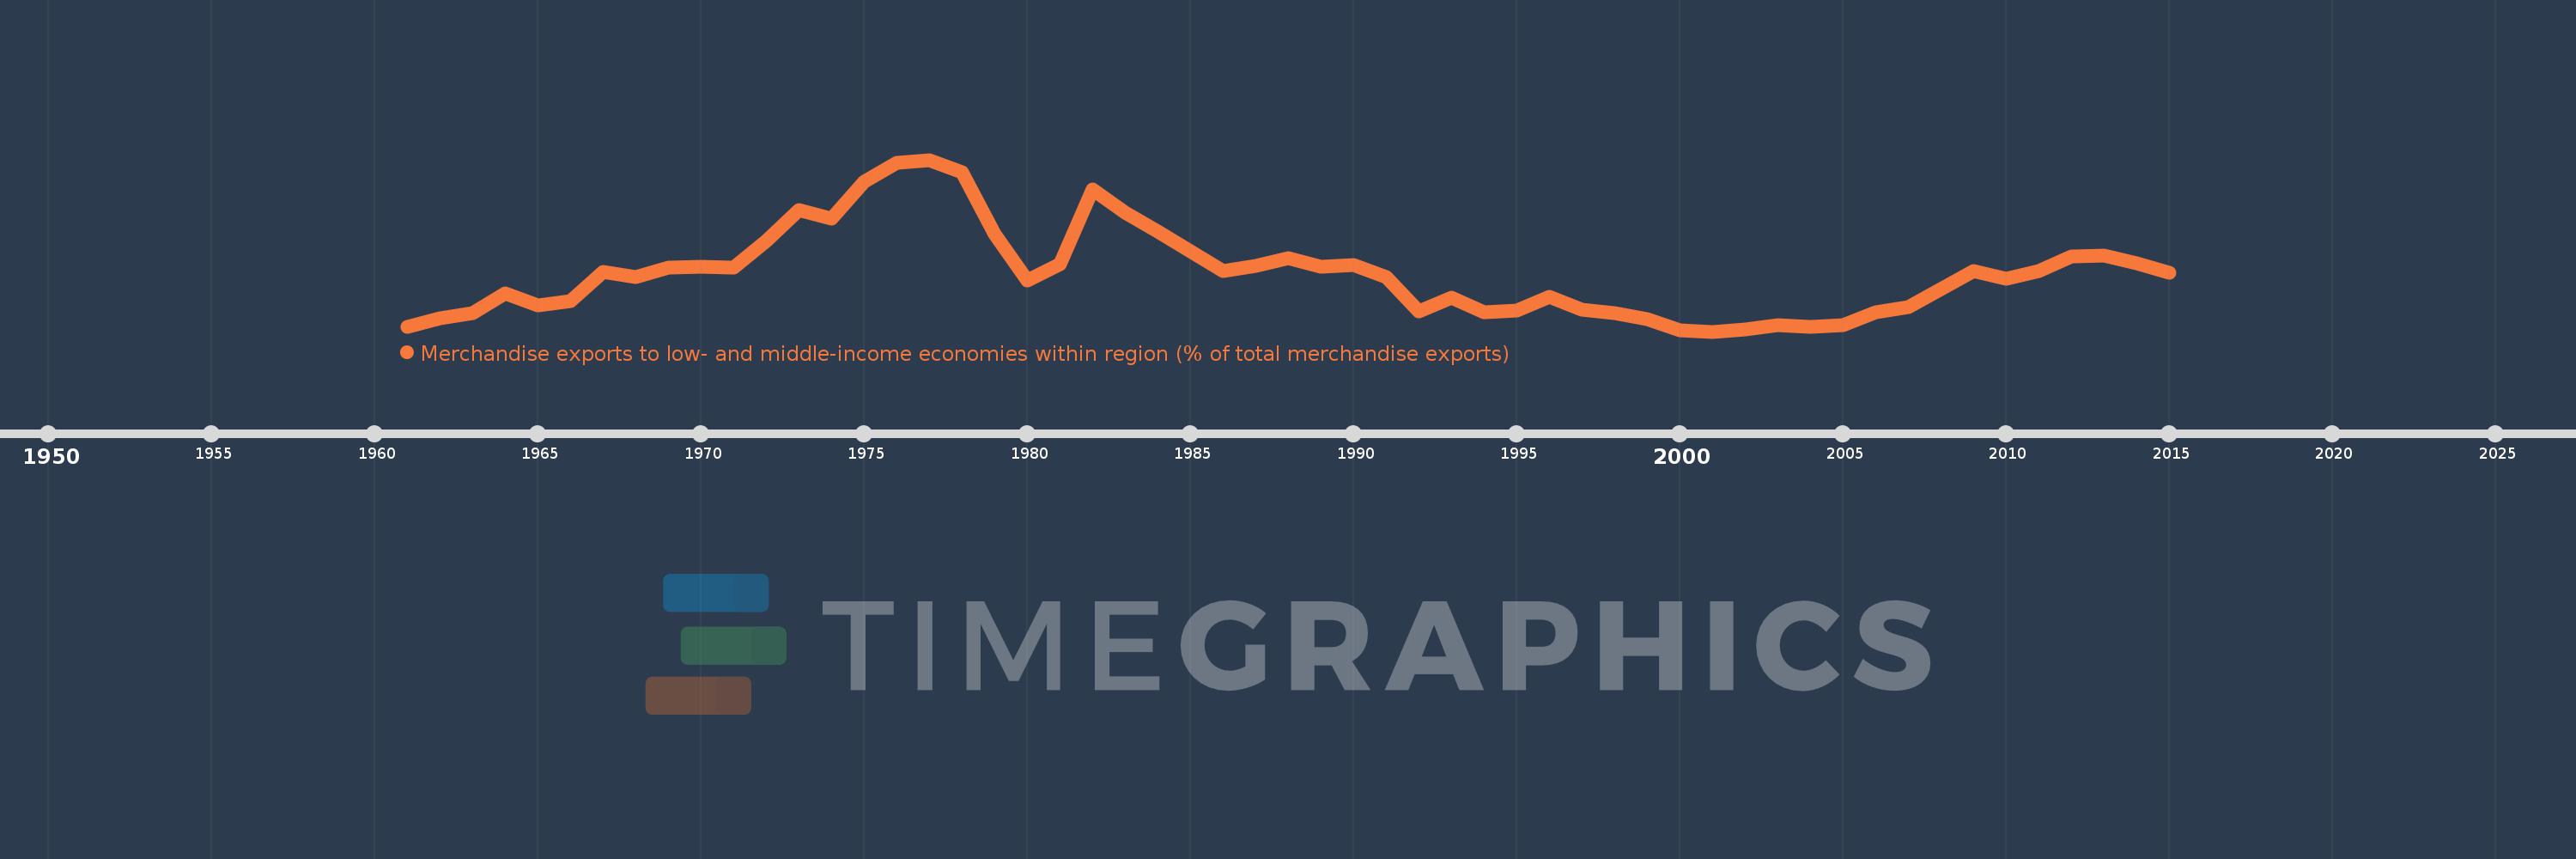
Merchandise exports to low- and middle-income economies within region (% of total merchandise exports)
2015,2014,2013,2012,2011,2010,2009,2008,2007,2006,2005,2004,2003,2002,2001,2000,1999,1998,1997,1996,1995,1994,1993,1992,1991,1990,1989,1988,1987,1986,1985,1984,1983,1982,1981,1980,1979,1978,1977,1976,1975,1974,1973,1972,1971,1970,1969,1968,1967,1966,1965,1964,1963,1962,1961
Queste statistiche in altri paesi:
Linea del tempo:
Questa scala temporale mostra un grafico dal 1961 anno al 2015 anno. Mexico. I dati fino ad 1960 anno non disponibili. Il numero di osservazioni attuali secondo i date: 55.
La fonte (nome):
Indicatori dello sviluppo mondiale
La fonte (organizzazione):
World Bank staff estimates based data from International Monetary Fund's Direction of Trade database.
Categorie:
Private Sector, Trade
sono stati aggiornati
23 apr 2017 anni
Indicatori delle variazioni dei valori per anni
Minima:
2.334
1 gen 2001 anni
Massimo:
10.116
1 gen 1977 anni
Alla data di osservazione
Valore
Variazione assoluta
La variazione rispetto al valore precedente
1 gen 1961 anni
2.551
+2.551
0.0%
1 gen 1962 anni
2.943
+0.392
15.38%
1 gen 1963 anni
3.159
+0.216
7.33%
1 gen 1964 anni
4.047
+0.888
28.13%
1 gen 1965 anni
3.519
-0.529
-13.06%
1 gen 1966 anni
3.706
+0.187
5.32%
1 gen 1967 anni
5.038
+1.332
35.96%
1 gen 1968 anni
4.812
-0.226
-4.48%
1 gen 1969 anni
5.243
+0.431
8.96%
1 gen 1970 anni
5.289
+0.045
0.86%
1 gen 1971 anni
5.218
-0.07
-1.33%
1 gen 1972 anni
6.439
+1.221
23.39%
1 gen 1973 anni
7.823
+1.385
21.5%
1 gen 1974 anni
7.464
-0.359
-4.59%
1 gen 1975 anni
9.105
+1.64
21.97%
1 gen 1976 anni
9.985
+0.88
9.67%
1 gen 1977 anni
10.116
+0.131
1.31%
1 gen 1978 anni
9.533
-0.582
-5.76%
1 gen 1979 anni
6.752
-2.781
-29.17%
1 gen 1980 anni
4.668
-2.085
-30.87%
1 gen 1981 anni
5.383
+0.715
15.32%
1 gen 1982 anni
8.766
+3.383
62.85%
1 gen 1983 anni
7.707
-1.059
-12.08%
1 gen 1984 anni
6.852
-0.855
-11.09%
1 gen 1985 anni
5.972
-0.88
-12.84%
1 gen 1986 anni
5.085
-0.888
-14.86%
1 gen 1987 anni
5.313
+0.229
4.49%
1 gen 1988 anni
5.66
+0.347
6.52%
1 gen 1989 anni
5.279
-0.38
-6.72%
1 gen 1990 anni
5.338
+0.058
1.1%
1 gen 1991 anni
4.809
-0.529
-9.91%
1 gen 1992 anni
3.229
-1.58
-32.85%
1 gen 1993 anni
3.863
+0.634
19.64%
1 gen 1994 anni
3.213
-0.65
-16.83%
1 gen 1995 anni
3.273
+0.06
1.87%
1 gen 1996 anni
3.926
+0.653
19.94%
1 gen 1997 anni
3.344
-0.581
-14.81%
1 gen 1998 anni
3.186
-0.158
-4.72%
1 gen 1999 anni
2.899
-0.287
-9.01%
1 gen 2000 anni
2.408
-0.491
-16.95%
1 gen 2001 anni
2.334
-0.074
-3.07%
1 gen 2002 anni
2.441
+0.107
4.61%
1 gen 2003 anni
2.64
+0.199
8.14%
1 gen 2004 anni
2.551
-0.089
-3.36%
1 gen 2005 anni
2.642
+0.091
3.55%
1 gen 2006 anni
3.206
+0.564
21.36%
1 gen 2007 anni
3.46
+0.254
7.91%
1 gen 2008 anni
4.259
+0.8
23.12%
1 gen 2009 anni
5.066
+0.806
18.93%
1 gen 2010 anni
4.719
-0.347
-6.84%
1 gen 2011 anni
5.094
+0.375
7.95%
1 gen 2012 anni
5.724
+0.63
12.36%
1 gen 2013 anni
5.779
+0.055
0.96%
1 gen 2014 anni
5.43
-0.349
-6.04%
1 gen 2015 anni
4.998
-0.432
-7.95%
Classificazione dei paesi secondo i statistiche attuali per anni


Commenti: