29
/it/
it
AIzaSyAYiBZKx7MnpbEhh9jyipgxe19OcubqV5w
April 1, 2024
262541
Thailand
THA
true
2
1
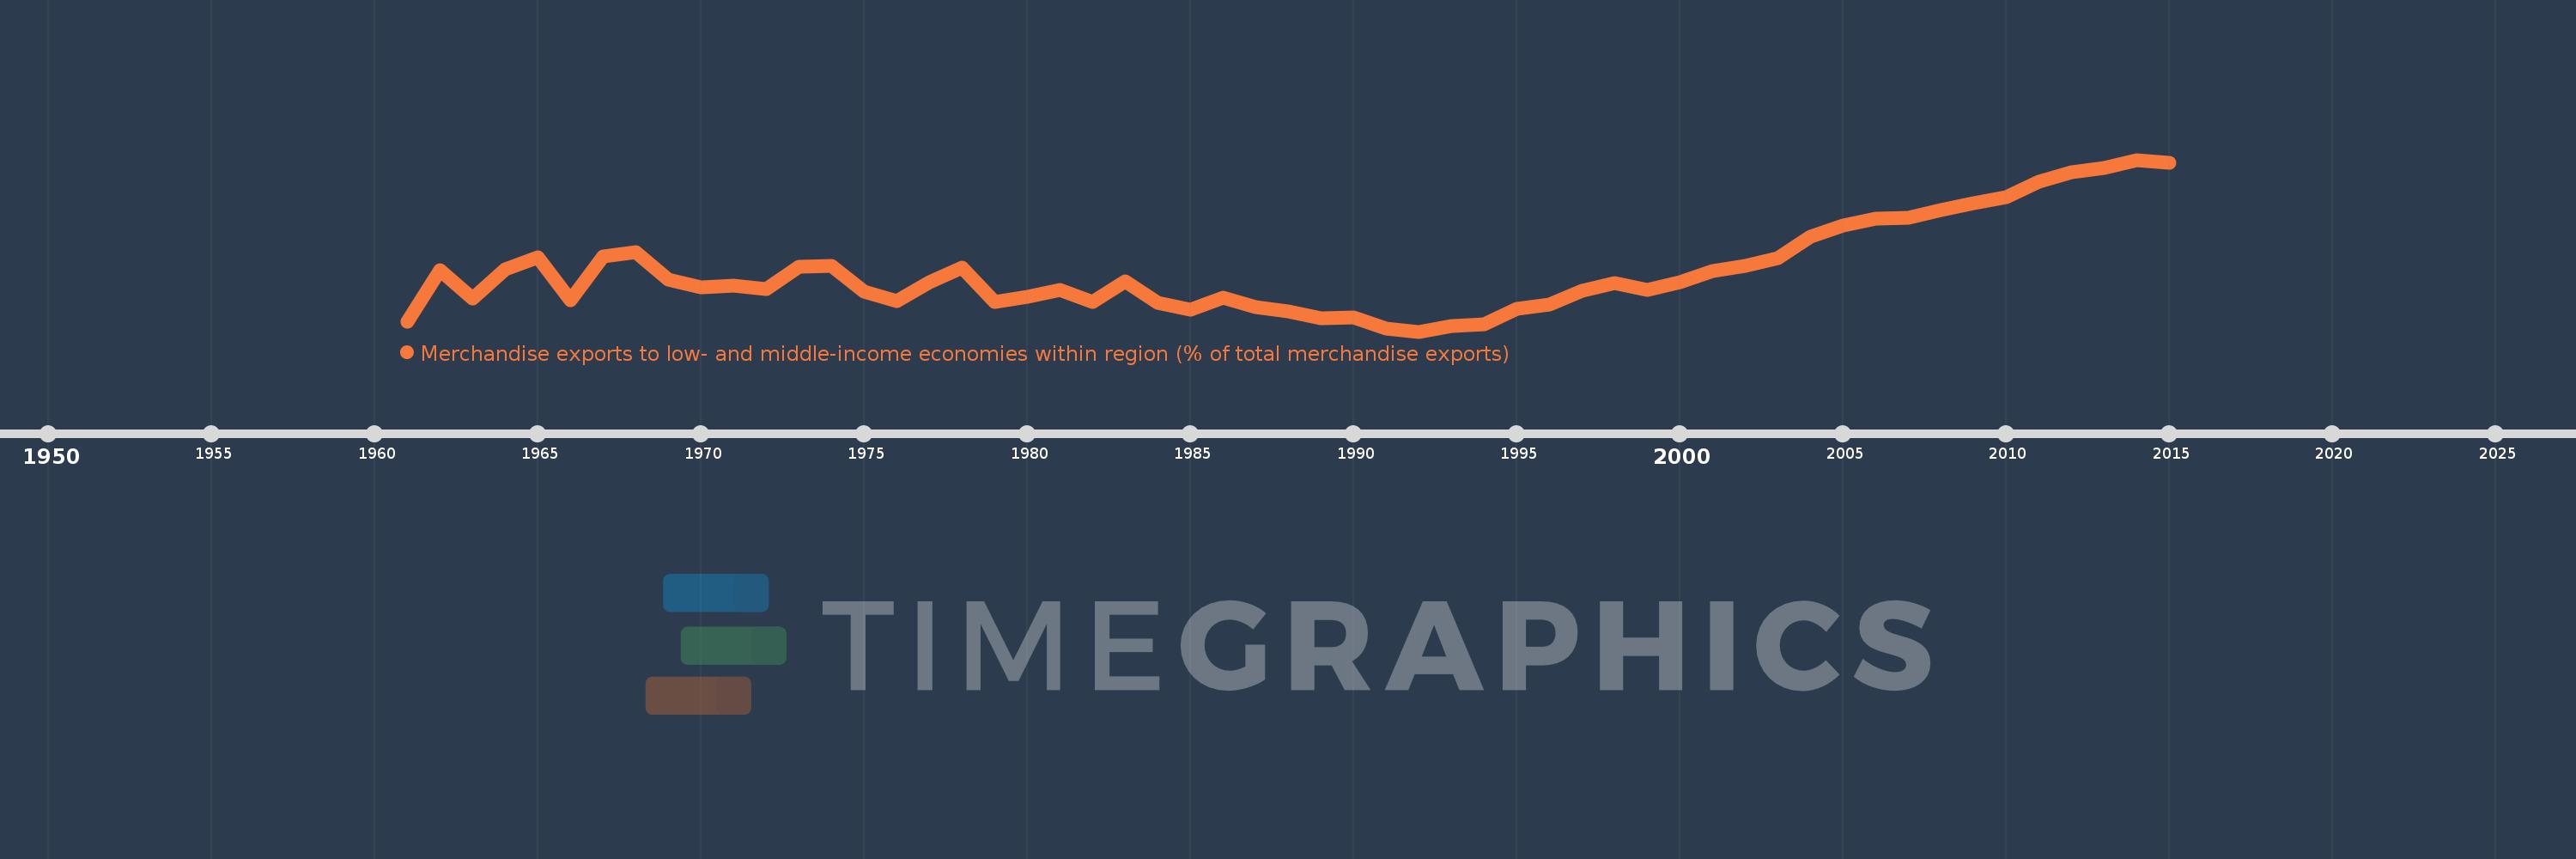
Merchandise exports to low- and middle-income economies within region (% of total merchandise exports)
2015,2014,2013,2012,2011,2010,2009,2008,2007,2006,2005,2004,2003,2002,2001,2000,1999,1998,1997,1996,1995,1994,1993,1992,1991,1990,1989,1988,1987,1986,1985,1984,1983,1982,1981,1980,1979,1978,1977,1976,1975,1974,1973,1972,1971,1970,1969,1968,1967,1966,1965,1964,1963,1962,1961
Queste statistiche in altri paesi:
Linea del tempo:
Questa scala temporale mostra un grafico dal 1961 anno al 2015 anno. Thailand. I dati fino ad 1960 anno non disponibili. Il numero di osservazioni attuali secondo i date: 55.
La fonte (nome):
Indicatori dello sviluppo mondiale
La fonte (organizzazione):
World Bank staff estimates based data from International Monetary Fund's Direction of Trade database.
Categorie:
Private Sector, Trade
sono stati aggiornati
23 apr 2017 anni
Indicatori delle variazioni dei valori per anni
Minima:
5.193
1 gen 1992 anni
Massimo:
33.064
1 gen 2014 anni
Alla data di osservazione
Valore
Variazione assoluta
La variazione rispetto al valore precedente
1 gen 1961 anni
6.798
+6.798
0.0%
1 gen 1962 anni
15.18
+8.382
123.29%
1 gen 1963 anni
10.55
-4.631
-30.5%
1 gen 1964 anni
15.343
+4.793
45.44%
1 gen 1965 anni
17.201
+1.859
12.11%
1 gen 1966 anni
10.267
-6.935
-40.31%
1 gen 1967 anni
17.406
+7.14
69.54%
1 gen 1968 anni
18.141
+0.734
4.22%
1 gen 1969 anni
13.659
-4.481
-24.7%
1 gen 1970 anni
12.345
-1.314
-9.62%
1 gen 1971 anni
12.586
+0.24
1.95%
1 gen 1972 anni
12.116
-0.47
-3.73%
1 gen 1973 anni
15.76
+3.644
30.07%
1 gen 1974 anni
15.874
+0.114
0.73%
1 gen 1975 anni
11.704
-4.171
-26.27%
1 gen 1976 anni
10.148
-1.555
-13.29%
1 gen 1977 anni
13.254
+3.106
30.6%
1 gen 1978 anni
15.599
+2.344
17.69%
1 gen 1979 anni
10.063
-5.535
-35.49%
1 gen 1980 anni
10.904
+0.841
8.36%
1 gen 1981 anni
11.883
+0.979
8.98%
1 gen 1982 anni
10.017
-1.866
-15.7%
1 gen 1983 anni
13.363
+3.346
33.4%
1 gen 1984 anni
9.811
-3.552
-26.58%
1 gen 1985 anni
8.748
-1.064
-10.84%
1 gen 1986 anni
10.75
+2.002
22.89%
1 gen 1987 anni
9.135
-1.614
-15.02%
1 gen 1988 anni
8.417
-0.718
-7.86%
1 gen 1989 anni
7.42
-0.998
-11.85%
1 gen 1990 anni
7.503
+0.084
1.13%
1 gen 1991 anni
5.739
-1.765
-23.52%
1 gen 1992 anni
5.193
-0.546
-9.51%
1 gen 1993 anni
6.048
+0.855
16.46%
1 gen 1994 anni
6.408
+0.36
5.95%
1 gen 1995 anni
8.935
+2.527
39.44%
1 gen 1996 anni
9.638
+0.703
7.87%
1 gen 1997 anni
11.755
+2.117
21.96%
1 gen 1998 anni
13.0
+1.245
10.59%
1 gen 1999 anni
11.965
-1.036
-7.97%
1 gen 2000 anni
13.158
+1.194
9.98%
1 gen 2001 anni
14.995
+1.836
13.96%
1 gen 2002 anni
15.791
+0.796
5.31%
1 gen 2003 anni
17.052
+1.261
7.98%
1 gen 2004 anni
20.655
+3.603
21.13%
1 gen 2005 anni
22.358
+1.703
8.24%
1 gen 2006 anni
23.549
+1.191
5.33%
1 gen 2007 anni
23.627
+0.078
0.33%
1 gen 2008 anni
24.861
+1.235
5.23%
1 gen 2009 anni
26.061
+1.2
4.83%
1 gen 2010 anni
26.99
+0.928
3.56%
1 gen 2011 anni
29.448
+2.459
9.11%
1 gen 2012 anni
31.033
+1.585
5.38%
1 gen 2013 anni
31.756
+0.723
2.33%
1 gen 2014 anni
33.064
+1.308
4.12%
1 gen 2015 anni
32.64
-0.424
-1.28%
Classificazione dei paesi secondo i statistiche attuali per anni


Commenti: