29
/it/
it
AIzaSyAYiBZKx7MnpbEhh9jyipgxe19OcubqV5w
April 1, 2024
264123
Timor-Leste
TLS
true
2
1
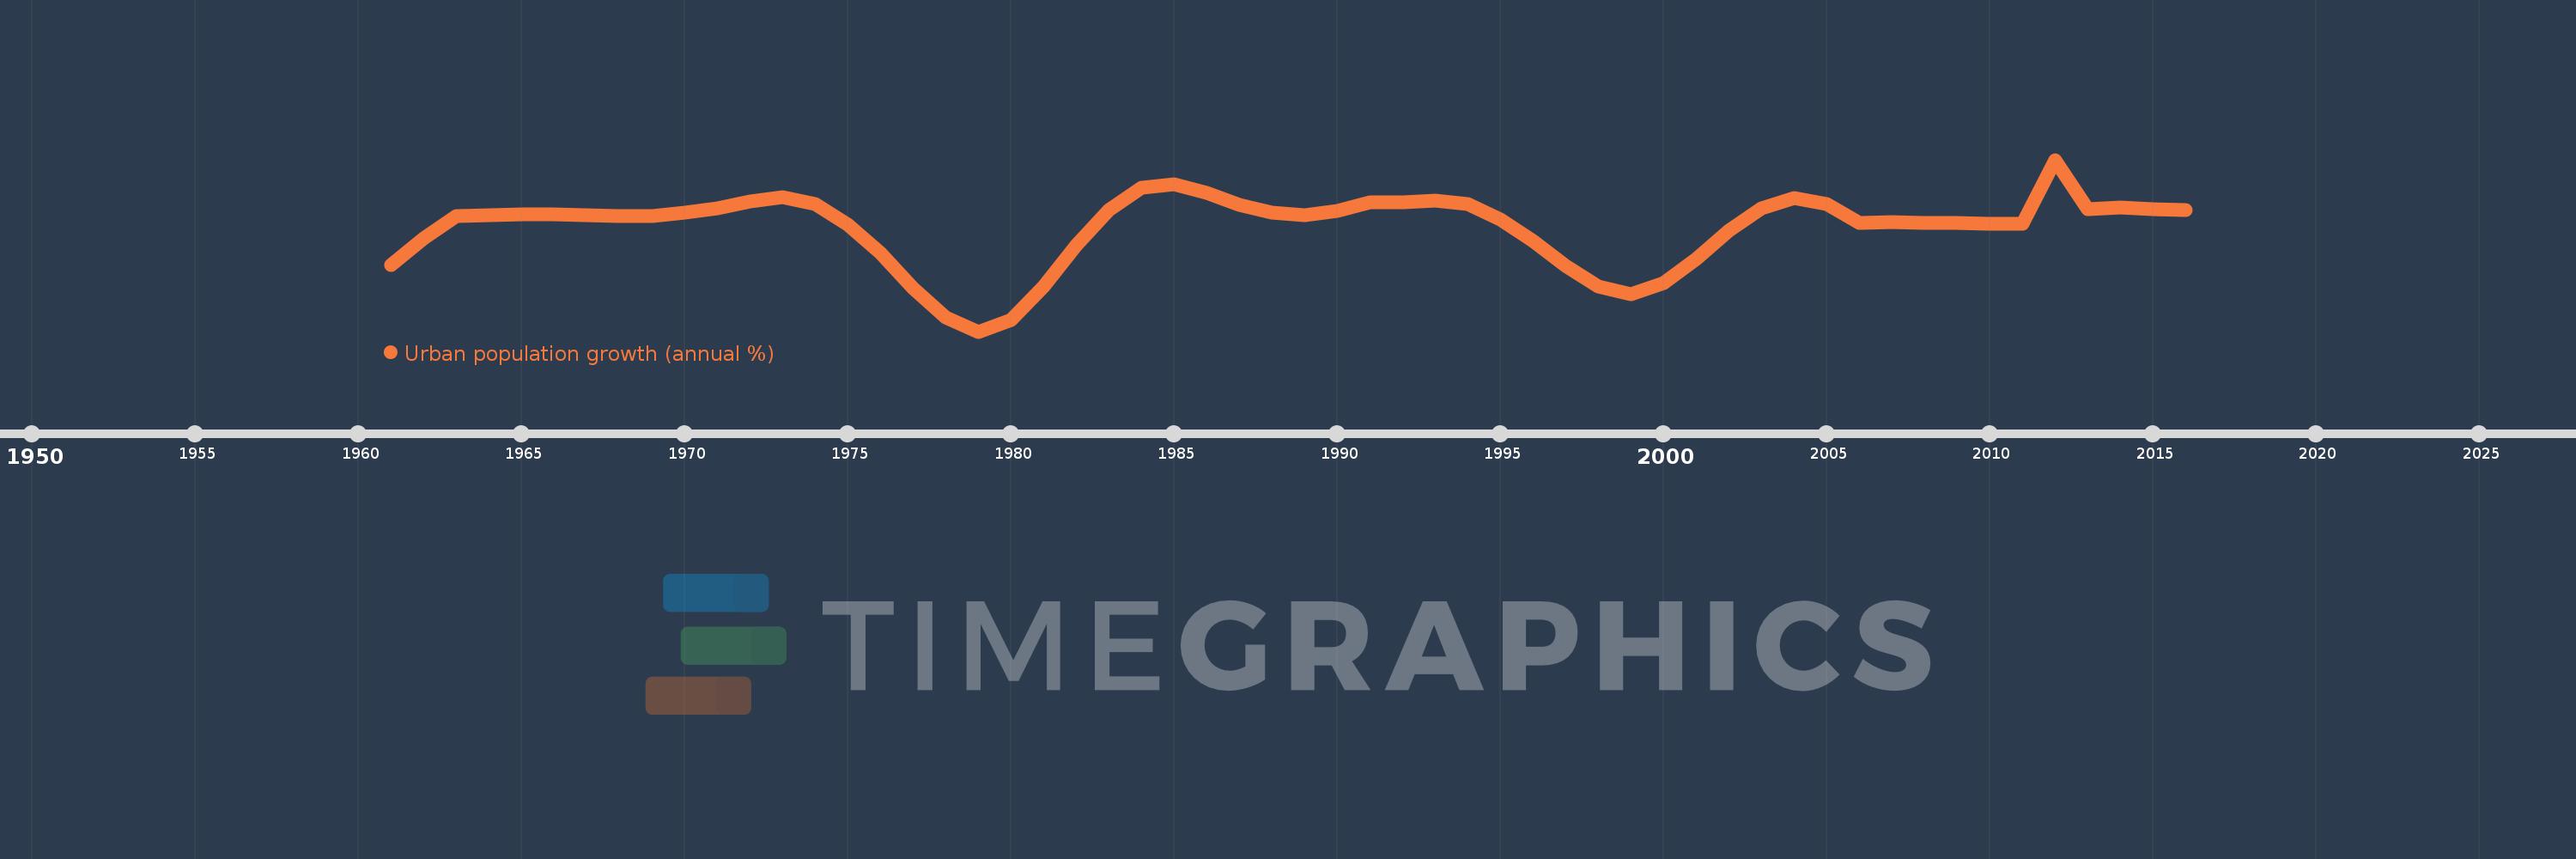
Urban population growth (annual %)
2016,2015,2014,2013,2012,2011,2010,2009,2008,2007,2006,2005,2004,2003,2002,2001,2000,1999,1998,1997,1996,1995,1994,1993,1992,1991,1990,1989,1988,1987,1986,1985,1984,1983,1982,1981,1980,1979,1978,1977,1976,1975,1974,1973,1972,1971,1970,1969,1968,1967,1966,1965,1964,1963,1962,1961
Queste statistiche in altri paesi:
AfghanistanAlbaniaAlgeriaAmerican SamoaAndorraAngolaAntigua and BarbudaArab WorldArgentinaArmeniaArubaAustraliaAustriaAzerbaijanBahamas, TheBahrainBangladeshBarbadosBelarusBelgiumBelizeBeninBermudaBhutanBoliviaBosnia and HerzegovinaBotswanaBrazilBritish Virgin IslandsBrunei DarussalamBulgariaBurkina FasoBurundiCabo VerdeCambodiaCameroonCanadaCaribbean small statesCayman IslandsCentral African RepublicCentral Europe and the BalticsChadChannel IslandsChileChinaColombiaComorosCongo, Dem. Rep.Congo, Rep.Costa RicaCote d'IvoireCroatiaCubaCuracaoCyprusCzech RepublicDenmarkDjiboutiDominicaDominican RepublicEarly-demographic dividendEast Asia & PacificEast Asia & Pacific (excluding high income)East Asia & Pacific (IDA & IBRD countries)EcuadorEgypt, Arab Rep.El SalvadorEquatorial GuineaEritreaEstoniaEthiopiaEuro areaEurope & Central AsiaEurope & Central Asia (excluding high income)Europe & Central Asia (IDA & IBRD countries)European UnionFaroe IslandsFijiFinlandFragile and conflict affected situationsFranceFrench PolynesiaGabonGambia, TheGeorgiaGermanyGhanaGibraltarGreeceGreenlandGrenadaGuamGuatemalaGuineaGuinea-BissauGuyanaHaitiHeavily indebted poor countries (HIPC)High incomeHondurasHong Kong SAR, ChinaHungaryIBRD onlyIcelandIDA & IBRD totalIDA blendIDA onlyIDA totalIndiaIndonesiaIran, Islamic Rep.IraqIrelandIsle of ManIsraelItalyJamaicaJapanJordanKazakhstanKenyaKiribatiKorea, Dem. People’s Rep.Korea, Rep.KuwaitKyrgyz RepublicLao PDRLate-demographic dividendLatin America & Caribbean Latin America & Caribbean (excluding high income)Latin America & the Caribbean (IDA & IBRD countries)LatviaLeast developed countries: UN classificationLebanonLesothoLiberiaLibyaLiechtensteinLithuaniaLow & middle incomeLow incomeLower middle incomeLuxembourgMacao SAR, ChinaMacedonia, FYRMadagascarMalawiMalaysiaMaldivesMaliMaltaMarshall IslandsMauritaniaMauritiusMexicoMicronesia, Fed. Sts.Middle East & North AfricaMiddle East & North Africa (excluding high income)Middle East & North Africa (IDA & IBRD countries)Middle incomeMoldovaMonacoMongoliaMontenegroMoroccoMozambiqueMyanmarNamibiaNauruNepalNetherlandsNew CaledoniaNew ZealandNicaraguaNigerNigeriaNorth AmericaNorthern Mariana IslandsNorwayOECD membersOmanOther small statesPacific island small statesPakistanPalauPanamaPapua New GuineaParaguayPeruPhilippinesPolandPortugalPost-demographic dividendPre-demographic dividendPuerto RicoQatarRomaniaRussian FederationRwandaSamoaSan MarinoSao Tome and PrincipeSaudi ArabiaSenegalSerbiaSeychellesSierra LeoneSingaporeSint Maarten (Dutch part)Slovak RepublicSloveniaSmall statesSolomon IslandsSomaliaSouth AfricaSouth AsiaSouth Asia (IDA & IBRD)South SudanSpainSri LankaSt. Kitts and NevisSt. LuciaSt. Vincent and the GrenadinesSub-Saharan Africa Sub-Saharan Africa (excluding high income)Sub-Saharan Africa (IDA & IBRD countries)SudanSurinameSwazilandSwedenSwitzerlandSyrian Arab RepublicTajikistanTanzaniaThailandTimor-LesteTogoTongaTrinidad and TobagoTunisiaTurkeyTurkmenistanTurks and Caicos IslandsTuvaluUgandaUkraineUnited Arab EmiratesUnited KingdomUnited StatesUpper middle incomeUruguayUzbekistanVanuatuVenezuela, RBVietnamVirgin Islands (U.S.)West Bank and GazaWorldYemen, Rep.ZambiaZimbabwe Linea del tempo:
Questa scala temporale mostra un grafico dal 1961 anno al 2016 anno. Timor-Leste. I dati fino ad 1960 anno non disponibili. Il numero di osservazioni attuali secondo i date: 56.
La fonte (nome):
Indicatori dello sviluppo mondiale
La fonte (organizzazione):
World Bank Staff estimates based on United Nations, World Urbanization Prospects.
Categorie:
Climate Change, Urban Development
sono stati aggiornati
23 apr 2017 anni
Indicatori delle variazioni dei valori per anni
Minima:
-1.422
1 gen 1979 anni
Massimo:
7.163
1 gen 2012 anni
Alla data di osservazione
Valore
Variazione assoluta
La variazione rispetto al valore precedente
1 gen 1961 anni
1.901
+1.901
0.0%
1 gen 1962 anni
3.238
+1.338
70.38%
1 gen 1963 anni
4.365
+1.127
34.8%
1 gen 1964 anni
4.39
+0.025
0.58%
1 gen 1965 anni
4.426
+0.036
0.82%
1 gen 1966 anni
4.45
+0.024
0.53%
1 gen 1967 anni
4.399
-0.051
-1.14%
1 gen 1968 anni
4.335
-0.064
-1.46%
1 gen 1969 anni
4.371
+0.036
0.84%
1 gen 1970 anni
4.526
+0.155
3.55%
1 gen 1971 anni
4.732
+0.207
4.56%
1 gen 1972 anni
5.088
+0.356
7.51%
1 gen 1973 anni
5.309
+0.221
4.35%
1 gen 1974 anni
4.958
-0.352
-6.62%
1 gen 1975 anni
3.923
-1.035
-20.87%
1 gen 1976 anni
2.485
-1.437
-36.64%
1 gen 1977 anni
0.758
-1.727
-69.49%
1 gen 1978 anni
-0.732
-1.491
-196.59%
1 gen 1979 anni
-1.422
-0.69
94.19%
1 gen 1980 anni
-0.832
+0.59
-41.5%
1 gen 1981 anni
0.822
+1.654
-198.74%
1 gen 1982 anni
2.911
+2.089
254.29%
1 gen 1983 anni
4.667
+1.756
60.34%
1 gen 1984 anni
5.766
+1.099
23.55%
1 gen 1985 anni
5.93
+0.164
2.84%
1 gen 1986 anni
5.495
-0.435
-7.34%
1 gen 1987 anni
4.914
-0.581
-10.57%
1 gen 1988 anni
4.536
-0.378
-7.69%
1 gen 1989 anni
4.404
-0.133
-2.92%
1 gen 1990 anni
4.617
+0.213
4.84%
1 gen 1991 anni
5.035
+0.418
9.05%
1 gen 1992 anni
5.05
+0.015
0.3%
1 gen 1993 anni
5.111
+0.061
1.21%
1 gen 1994 anni
4.931
-0.179
-3.51%
1 gen 1995 anni
4.187
-0.745
-15.1%
1 gen 1996 anni
3.109
-1.078
-25.75%
1 gen 1997 anni
1.85
-1.259
-40.5%
1 gen 1998 anni
0.827
-1.023
-55.31%
1 gen 1999 anni
0.448
-0.379
-45.81%
1 gen 2000 anni
0.991
+0.543
121.21%
1 gen 2001 anni
2.191
+1.2
121.06%
1 gen 2002 anni
3.636
+1.445
65.97%
1 gen 2003 anni
4.745
+1.109
30.5%
1 gen 2004 anni
5.24
+0.495
10.44%
1 gen 2005 anni
4.948
-0.292
-5.58%
1 gen 2006 anni
4.029
-0.919
-18.58%
1 gen 2007 anni
4.035
+0.007
0.16%
1 gen 2008 anni
4.018
-0.017
-0.42%
1 gen 2009 anni
3.998
-0.02
-0.51%
1 gen 2010 anni
3.974
-0.024
-0.59%
1 gen 2011 anni
3.958
-0.016
-0.41%
1 gen 2012 anni
7.163
+3.206
80.99%
1 gen 2013 anni
4.685
-2.478
-34.6%
1 gen 2014 anni
4.768
+0.082
1.76%
1 gen 2015 anni
4.71
-0.058
-1.22%
1 gen 2016 anni
4.648
-0.062
-1.31%
Classificazione dei paesi secondo i statistiche attuali per anni


Commenti: