29
/it/
it
AIzaSyAYiBZKx7MnpbEhh9jyipgxe19OcubqV5w
April 1, 2024
227086
Puerto Rico
PRI
true
2
1
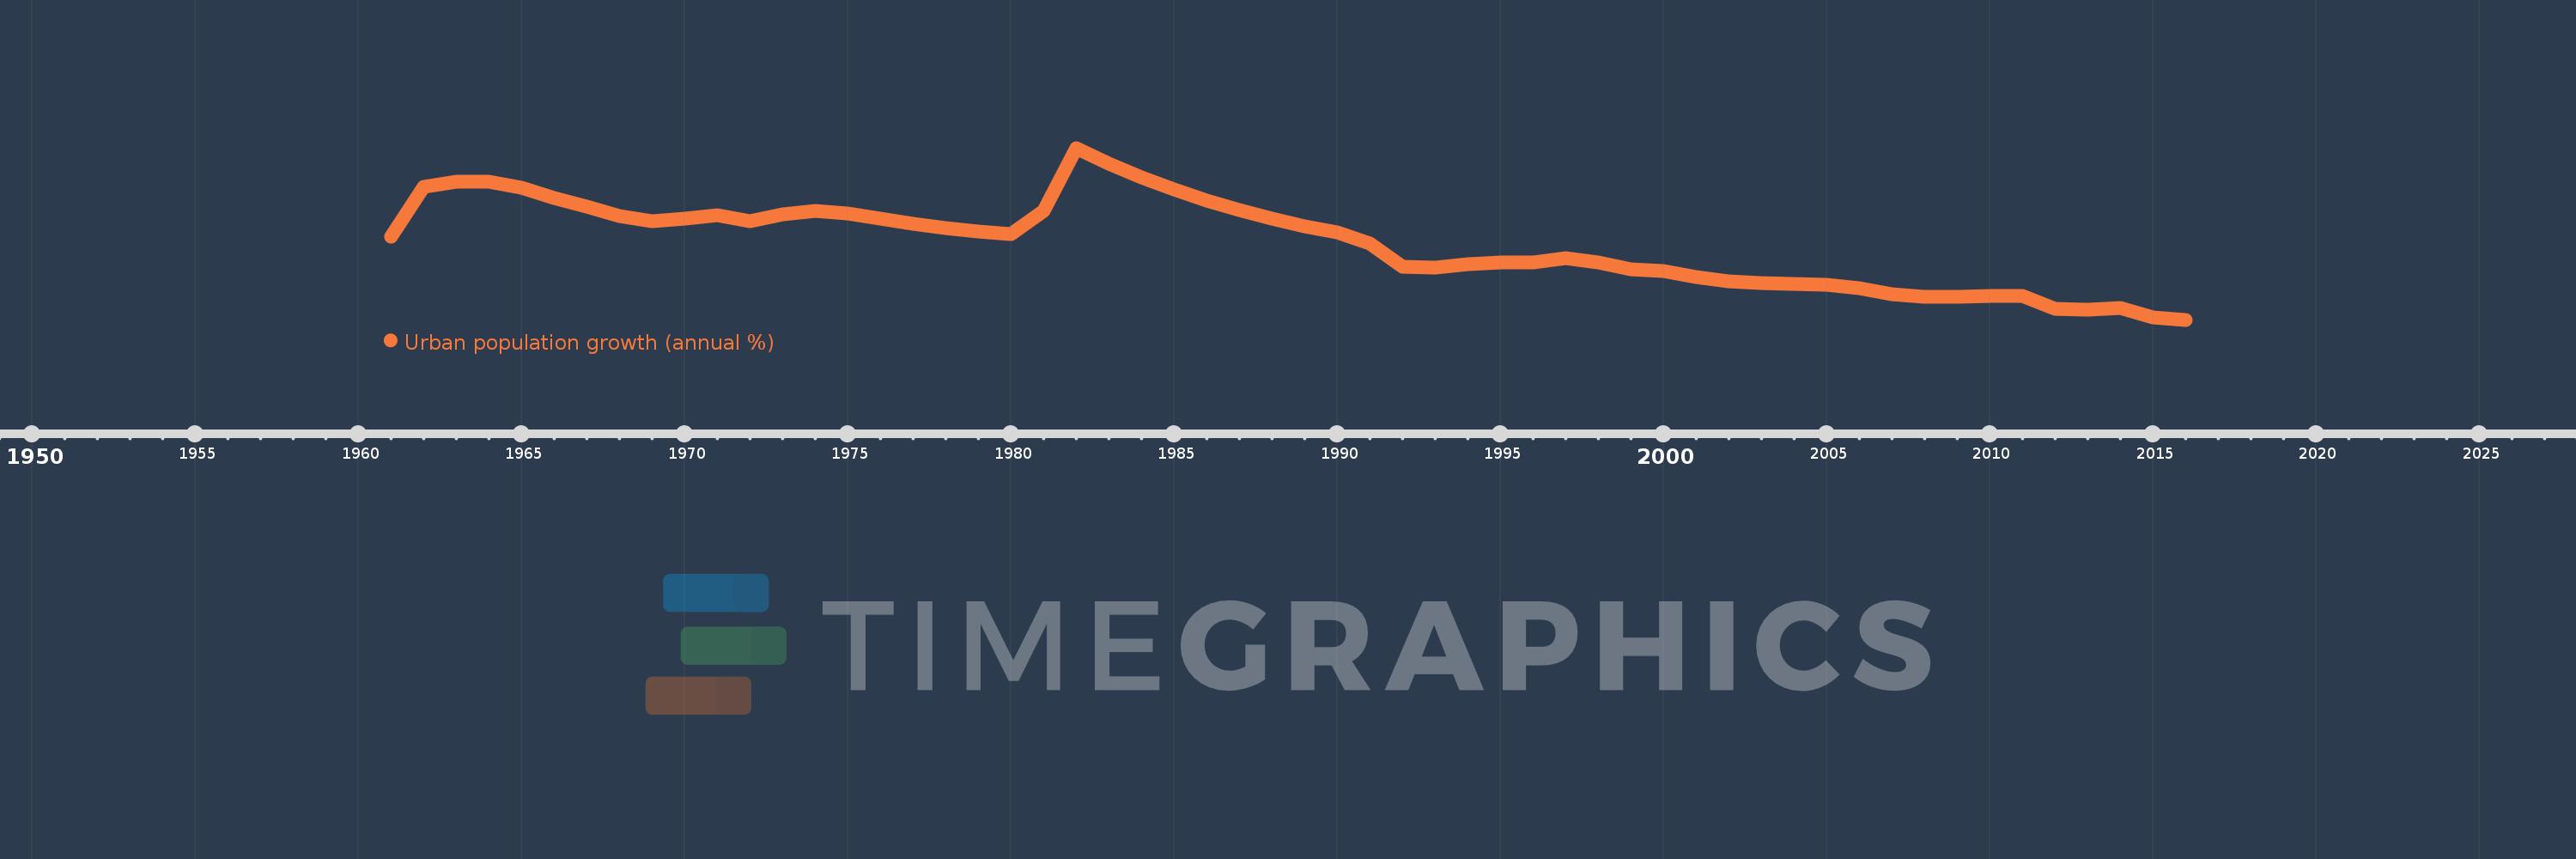
Urban population growth (annual %)
2016,2015,2014,2013,2012,2011,2010,2009,2008,2007,2006,2005,2004,2003,2002,2001,2000,1999,1998,1997,1996,1995,1994,1993,1992,1991,1990,1989,1988,1987,1986,1985,1984,1983,1982,1981,1980,1979,1978,1977,1976,1975,1974,1973,1972,1971,1970,1969,1968,1967,1966,1965,1964,1963,1962,1961
Queste statistiche in altri paesi:
AfghanistanAlbaniaAlgeriaAmerican SamoaAndorraAngolaAntigua and BarbudaArab WorldArgentinaArmeniaArubaAustraliaAustriaAzerbaijanBahamas, TheBahrainBangladeshBarbadosBelarusBelgiumBelizeBeninBermudaBhutanBoliviaBosnia and HerzegovinaBotswanaBrazilBritish Virgin IslandsBrunei DarussalamBulgariaBurkina FasoBurundiCabo VerdeCambodiaCameroonCanadaCaribbean small statesCayman IslandsCentral African RepublicCentral Europe and the BalticsChadChannel IslandsChileChinaColombiaComorosCongo, Dem. Rep.Congo, Rep.Costa RicaCote d'IvoireCroatiaCubaCuracaoCyprusCzech RepublicDenmarkDjiboutiDominicaDominican RepublicEarly-demographic dividendEast Asia & PacificEast Asia & Pacific (excluding high income)East Asia & Pacific (IDA & IBRD countries)EcuadorEgypt, Arab Rep.El SalvadorEquatorial GuineaEritreaEstoniaEthiopiaEuro areaEurope & Central AsiaEurope & Central Asia (excluding high income)Europe & Central Asia (IDA & IBRD countries)European UnionFaroe IslandsFijiFinlandFragile and conflict affected situationsFranceFrench PolynesiaGabonGambia, TheGeorgiaGermanyGhanaGibraltarGreeceGreenlandGrenadaGuamGuatemalaGuineaGuinea-BissauGuyanaHaitiHeavily indebted poor countries (HIPC)High incomeHondurasHong Kong SAR, ChinaHungaryIBRD onlyIcelandIDA & IBRD totalIDA blendIDA onlyIDA totalIndiaIndonesiaIran, Islamic Rep.IraqIrelandIsle of ManIsraelItalyJamaicaJapanJordanKazakhstanKenyaKiribatiKorea, Dem. People’s Rep.Korea, Rep.KuwaitKyrgyz RepublicLao PDRLate-demographic dividendLatin America & Caribbean Latin America & Caribbean (excluding high income)Latin America & the Caribbean (IDA & IBRD countries)LatviaLeast developed countries: UN classificationLebanonLesothoLiberiaLibyaLiechtensteinLithuaniaLow & middle incomeLow incomeLower middle incomeLuxembourgMacao SAR, ChinaMacedonia, FYRMadagascarMalawiMalaysiaMaldivesMaliMaltaMarshall IslandsMauritaniaMauritiusMexicoMicronesia, Fed. Sts.Middle East & North AfricaMiddle East & North Africa (excluding high income)Middle East & North Africa (IDA & IBRD countries)Middle incomeMoldovaMonacoMongoliaMontenegroMoroccoMozambiqueMyanmarNamibiaNauruNepalNetherlandsNew CaledoniaNew ZealandNicaraguaNigerNigeriaNorth AmericaNorthern Mariana IslandsNorwayOECD membersOmanOther small statesPacific island small statesPakistanPalauPanamaPapua New GuineaParaguayPeruPhilippinesPolandPortugalPost-demographic dividendPre-demographic dividendPuerto RicoQatarRomaniaRussian FederationRwandaSamoaSan MarinoSao Tome and PrincipeSaudi ArabiaSenegalSerbiaSeychellesSierra LeoneSingaporeSint Maarten (Dutch part)Slovak RepublicSloveniaSmall statesSolomon IslandsSomaliaSouth AfricaSouth AsiaSouth Asia (IDA & IBRD)South SudanSpainSri LankaSt. Kitts and NevisSt. LuciaSt. Vincent and the GrenadinesSub-Saharan Africa Sub-Saharan Africa (excluding high income)Sub-Saharan Africa (IDA & IBRD countries)SudanSurinameSwazilandSwedenSwitzerlandSyrian Arab RepublicTajikistanTanzaniaThailandTimor-LesteTogoTongaTrinidad and TobagoTunisiaTurkeyTurkmenistanTurks and Caicos IslandsTuvaluUgandaUkraineUnited Arab EmiratesUnited KingdomUnited StatesUpper middle incomeUruguayUzbekistanVanuatuVenezuela, RBVietnamVirgin Islands (U.S.)West Bank and GazaWorldYemen, Rep.ZambiaZimbabwe Linea del tempo:
Questa scala temporale mostra un grafico dal 1961 anno al 2016 anno. Puerto Rico. I dati fino ad 1960 anno non disponibili. Il numero di osservazioni attuali secondo i date: 56.
La fonte (nome):
Indicatori dello sviluppo mondiale
La fonte (organizzazione):
World Bank Staff estimates based on United Nations, World Urbanization Prospects.
Categorie:
Climate Change, Urban Development
sono stati aggiornati
23 apr 2017 anni
Indicatori delle variazioni dei valori per anni
Minima:
-1.771
1 gen 2016 anni
Massimo:
6.775
1 gen 1982 anni
Alla data di osservazione
Valore
Variazione assoluta
La variazione rispetto al valore precedente
1 gen 1961 anni
2.355
+2.355
0.0%
1 gen 1962 anni
4.818
+2.463
104.56%
1 gen 1963 anni
5.076
+0.259
5.37%
1 gen 1964 anni
5.097
+0.021
0.41%
1 gen 1965 anni
4.795
-0.302
-5.92%
1 gen 1966 anni
4.302
-0.493
-10.28%
1 gen 1967 anni
3.863
-0.439
-10.21%
1 gen 1968 anni
3.383
-0.48
-12.43%
1 gen 1969 anni
3.141
-0.242
-7.15%
1 gen 1970 anni
3.265
+0.124
3.94%
1 gen 1971 anni
3.421
+0.157
4.8%
1 gen 1972 anni
3.147
-0.274
-8.01%
1 gen 1973 anni
3.477
+0.33
10.48%
1 gen 1974 anni
3.625
+0.148
4.25%
1 gen 1975 anni
3.516
-0.109
-3.02%
1 gen 1976 anni
3.246
-0.269
-7.66%
1 gen 1977 anni
3.023
-0.223
-6.87%
1 gen 1978 anni
2.797
-0.226
-7.48%
1 gen 1979 anni
2.616
-0.18
-6.45%
1 gen 1980 anni
2.502
-0.114
-4.36%
1 gen 1981 anni
3.663
+1.16
46.37%
1 gen 1982 anni
6.775
+3.113
84.98%
1 gen 1983 anni
6.01
-0.765
-11.3%
1 gen 1984 anni
5.312
-0.698
-11.61%
1 gen 1985 anni
4.701
-0.611
-11.51%
1 gen 1986 anni
4.149
-0.552
-11.74%
1 gen 1987 anni
3.674
-0.475
-11.45%
1 gen 1988 anni
3.251
-0.423
-11.51%
1 gen 1989 anni
2.885
-0.366
-11.26%
1 gen 1990 anni
2.557
-0.327
-11.34%
1 gen 1991 anni
2.001
-0.556
-21.74%
1 gen 1992 anni
0.884
-1.118
-55.85%
1 gen 1993 anni
0.818
-0.065
-7.41%
1 gen 1994 anni
1.01
+0.192
23.48%
1 gen 1995 anni
1.094
+0.083
8.24%
1 gen 1996 anni
1.085
-0.009
-0.79%
1 gen 1997 anni
1.279
+0.194
17.84%
1 gen 1998 anni
1.083
-0.196
-15.33%
1 gen 1999 anni
0.725
-0.358
-33.06%
1 gen 2000 anni
0.646
-0.079
-10.84%
1 gen 2001 anni
0.371
-0.275
-42.59%
1 gen 2002 anni
0.157
-0.214
-57.7%
1 gen 2003 anni
0.071
-0.086
-54.99%
1 gen 2004 anni
0.005
-0.065
-92.5%
1 gen 2005 anni
-0.039
-0.044
-836.25%
1 gen 2006 anni
-0.204
-0.165
422.25%
1 gen 2007 anni
-0.483
-0.279
137.08%
1 gen 2008 anni
-0.646
-0.163
33.8%
1 gen 2009 anni
-0.647
-0.001
0.16%
1 gen 2010 anni
-0.607
+0.04
-6.2%
1 gen 2011 anni
-0.569
+0.038
-6.28%
1 gen 2012 anni
-1.214
-0.645
113.36%
1 gen 2013 anni
-1.262
-0.048
3.99%
1 gen 2014 anni
-1.195
+0.067
-5.34%
1 gen 2015 anni
-1.675
-0.481
40.22%
1 gen 2016 anni
-1.771
-0.095
5.68%
Classificazione dei paesi secondo i statistiche attuali per anni


Commenti: