29
/it/
it
AIzaSyAYiBZKx7MnpbEhh9jyipgxe19OcubqV5w
April 1, 2024
146457
Guinea
GIN
true
2
1
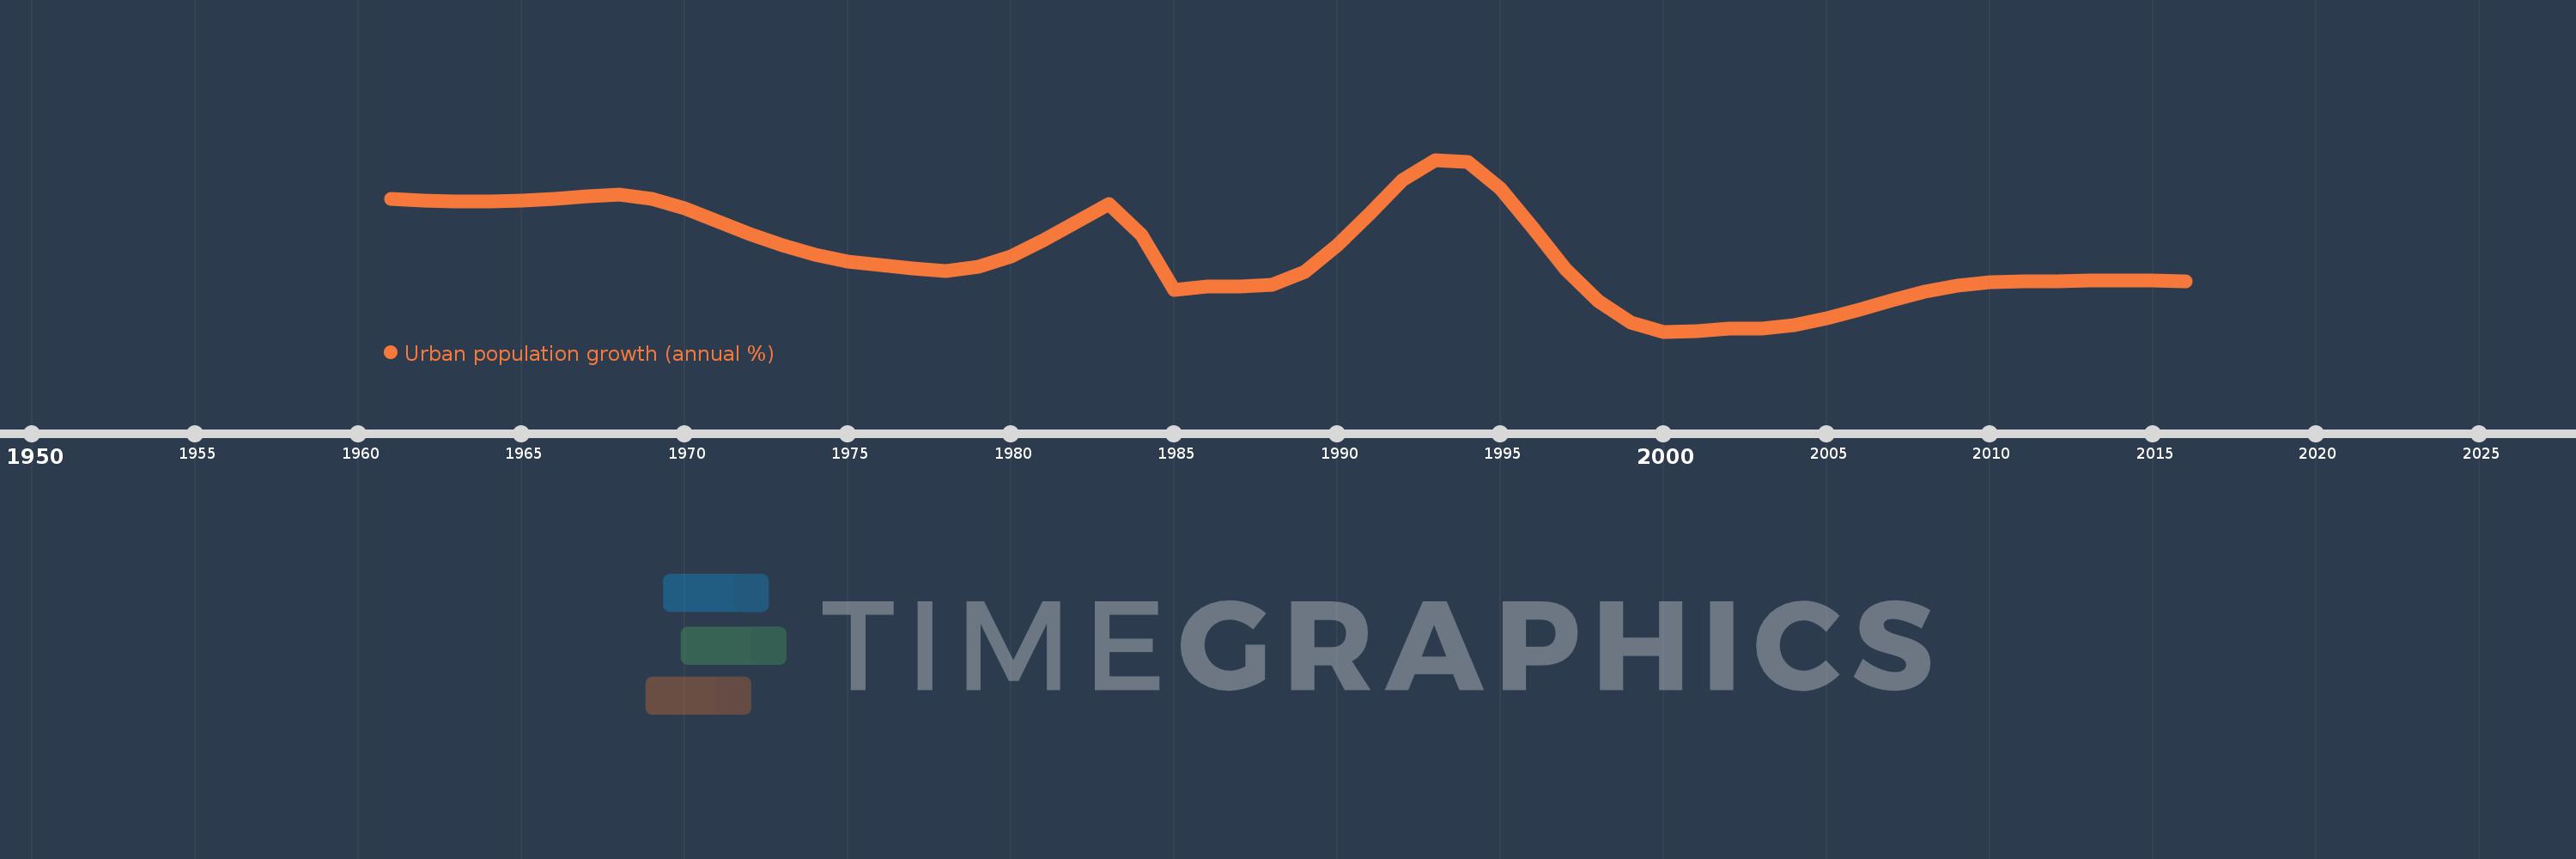
Urban population growth (annual %)
2016,2015,2014,2013,2012,2011,2010,2009,2008,2007,2006,2005,2004,2003,2002,2001,2000,1999,1998,1997,1996,1995,1994,1993,1992,1991,1990,1989,1988,1987,1986,1985,1984,1983,1982,1981,1980,1979,1978,1977,1976,1975,1974,1973,1972,1971,1970,1969,1968,1967,1966,1965,1964,1963,1962,1961
Queste statistiche in altri paesi:
AfghanistanAlbaniaAlgeriaAmerican SamoaAndorraAngolaAntigua and BarbudaArab WorldArgentinaArmeniaArubaAustraliaAustriaAzerbaijanBahamas, TheBahrainBangladeshBarbadosBelarusBelgiumBelizeBeninBermudaBhutanBoliviaBosnia and HerzegovinaBotswanaBrazilBritish Virgin IslandsBrunei DarussalamBulgariaBurkina FasoBurundiCabo VerdeCambodiaCameroonCanadaCaribbean small statesCayman IslandsCentral African RepublicCentral Europe and the BalticsChadChannel IslandsChileChinaColombiaComorosCongo, Dem. Rep.Congo, Rep.Costa RicaCote d'IvoireCroatiaCubaCuracaoCyprusCzech RepublicDenmarkDjiboutiDominicaDominican RepublicEarly-demographic dividendEast Asia & PacificEast Asia & Pacific (excluding high income)East Asia & Pacific (IDA & IBRD countries)EcuadorEgypt, Arab Rep.El SalvadorEquatorial GuineaEritreaEstoniaEthiopiaEuro areaEurope & Central AsiaEurope & Central Asia (excluding high income)Europe & Central Asia (IDA & IBRD countries)European UnionFaroe IslandsFijiFinlandFragile and conflict affected situationsFranceFrench PolynesiaGabonGambia, TheGeorgiaGermanyGhanaGibraltarGreeceGreenlandGrenadaGuamGuatemalaGuineaGuinea-BissauGuyanaHaitiHeavily indebted poor countries (HIPC)High incomeHondurasHong Kong SAR, ChinaHungaryIBRD onlyIcelandIDA & IBRD totalIDA blendIDA onlyIDA totalIndiaIndonesiaIran, Islamic Rep.IraqIrelandIsle of ManIsraelItalyJamaicaJapanJordanKazakhstanKenyaKiribatiKorea, Dem. People’s Rep.Korea, Rep.KuwaitKyrgyz RepublicLao PDRLate-demographic dividendLatin America & Caribbean Latin America & Caribbean (excluding high income)Latin America & the Caribbean (IDA & IBRD countries)LatviaLeast developed countries: UN classificationLebanonLesothoLiberiaLibyaLiechtensteinLithuaniaLow & middle incomeLow incomeLower middle incomeLuxembourgMacao SAR, ChinaMacedonia, FYRMadagascarMalawiMalaysiaMaldivesMaliMaltaMarshall IslandsMauritaniaMauritiusMexicoMicronesia, Fed. Sts.Middle East & North AfricaMiddle East & North Africa (excluding high income)Middle East & North Africa (IDA & IBRD countries)Middle incomeMoldovaMonacoMongoliaMontenegroMoroccoMozambiqueMyanmarNamibiaNauruNepalNetherlandsNew CaledoniaNew ZealandNicaraguaNigerNigeriaNorth AmericaNorthern Mariana IslandsNorwayOECD membersOmanOther small statesPacific island small statesPakistanPalauPanamaPapua New GuineaParaguayPeruPhilippinesPolandPortugalPost-demographic dividendPre-demographic dividendPuerto RicoQatarRomaniaRussian FederationRwandaSamoaSan MarinoSao Tome and PrincipeSaudi ArabiaSenegalSerbiaSeychellesSierra LeoneSingaporeSint Maarten (Dutch part)Slovak RepublicSloveniaSmall statesSolomon IslandsSomaliaSouth AfricaSouth AsiaSouth Asia (IDA & IBRD)South SudanSpainSri LankaSt. Kitts and NevisSt. LuciaSt. Vincent and the GrenadinesSub-Saharan Africa Sub-Saharan Africa (excluding high income)Sub-Saharan Africa (IDA & IBRD countries)SudanSurinameSwazilandSwedenSwitzerlandSyrian Arab RepublicTajikistanTanzaniaThailandTimor-LesteTogoTongaTrinidad and TobagoTunisiaTurkeyTurkmenistanTurks and Caicos IslandsTuvaluUgandaUkraineUnited Arab EmiratesUnited KingdomUnited StatesUpper middle incomeUruguayUzbekistanVanuatuVenezuela, RBVietnamVirgin Islands (U.S.)West Bank and GazaWorldYemen, Rep.ZambiaZimbabwe Linea del tempo:
Questa scala temporale mostra un grafico dal 1961 anno al 2016 anno. Guinea. I dati fino ad 1960 anno non disponibili. Il numero di osservazioni attuali secondo i date: 56.
La fonte (nome):
Indicatori dello sviluppo mondiale
La fonte (organizzazione):
World Bank Staff estimates based on United Nations, World Urbanization Prospects.
Categorie:
Climate Change, Urban Development
sono stati aggiornati
23 apr 2017 anni
Indicatori delle variazioni dei valori per anni
Minima:
2.782
1 gen 2000 anni
Massimo:
6.876
1 gen 1993 anni
Alla data di osservazione
Valore
Variazione assoluta
La variazione rispetto al valore precedente
1 gen 1961 anni
5.943
+5.943
0.0%
1 gen 1962 anni
5.899
-0.044
-0.74%
1 gen 1963 anni
5.875
-0.024
-0.41%
1 gen 1964 anni
5.879
+0.005
0.08%
1 gen 1965 anni
5.912
+0.033
0.57%
1 gen 1966 anni
5.953
+0.041
0.69%
1 gen 1967 anni
6.016
+0.063
1.06%
1 gen 1968 anni
6.037
+0.021
0.34%
1 gen 1969 anni
5.953
-0.084
-1.4%
1 gen 1970 anni
5.722
-0.231
-3.88%
1 gen 1971 anni
5.41
-0.312
-5.46%
1 gen 1972 anni
5.102
-0.307
-5.68%
1 gen 1973 anni
4.837
-0.265
-5.2%
1 gen 1974 anni
4.604
-0.233
-4.81%
1 gen 1975 anni
4.459
-0.145
-3.16%
1 gen 1976 anni
4.366
-0.093
-2.09%
1 gen 1977 anni
4.289
-0.077
-1.76%
1 gen 1978 anni
4.231
-0.059
-1.37%
1 gen 1979 anni
4.326
+0.096
2.26%
1 gen 1980 anni
4.583
+0.257
5.94%
1 gen 1981 anni
4.961
+0.378
8.24%
1 gen 1982 anni
5.393
+0.432
8.71%
1 gen 1983 anni
5.823
+0.43
7.97%
1 gen 1984 anni
5.08
-0.743
-12.76%
1 gen 1985 anni
3.766
-1.314
-25.87%
1 gen 1986 anni
3.863
+0.098
2.59%
1 gen 1987 anni
3.848
-0.016
-0.41%
1 gen 1988 anni
3.895
+0.047
1.23%
1 gen 1989 anni
4.2
+0.306
7.84%
1 gen 1990 anni
4.834
+0.633
15.08%
1 gen 1991 anni
5.604
+0.77
15.94%
1 gen 1992 anni
6.387
+0.783
13.98%
1 gen 1993 anni
6.876
+0.488
7.65%
1 gen 1994 anni
6.819
-0.056
-0.82%
1 gen 1995 anni
6.191
-0.629
-9.22%
1 gen 1996 anni
5.242
-0.949
-15.33%
1 gen 1997 anni
4.271
-0.971
-18.53%
1 gen 1998 anni
3.503
-0.767
-17.97%
1 gen 1999 anni
2.991
-0.512
-14.62%
1 gen 2000 anni
2.782
-0.209
-7.0%
1 gen 2001 anni
2.8
+0.019
0.67%
1 gen 2002 anni
2.848
+0.047
1.69%
1 gen 2003 anni
2.855
+0.007
0.26%
1 gen 2004 anni
2.942
+0.086
3.03%
1 gen 2005 anni
3.096
+0.154
5.24%
1 gen 2006 anni
3.297
+0.201
6.5%
1 gen 2007 anni
3.522
+0.225
6.83%
1 gen 2008 anni
3.734
+0.211
6.0%
1 gen 2009 anni
3.881
+0.147
3.95%
1 gen 2010 anni
3.959
+0.078
2.0%
1 gen 2011 anni
3.972
+0.013
0.33%
1 gen 2012 anni
3.98
+0.008
0.2%
1 gen 2013 anni
3.993
+0.013
0.33%
1 gen 2014 anni
3.996
+0.003
0.07%
1 gen 2015 anni
3.991
-0.005
-0.12%
1 gen 2016 anni
3.98
-0.011
-0.27%
Classificazione dei paesi secondo i statistiche attuali per anni


Commenti: