29
/it/
it
AIzaSyAYiBZKx7MnpbEhh9jyipgxe19OcubqV5w
April 1, 2024
262344
Thailand
THA
true
2
1
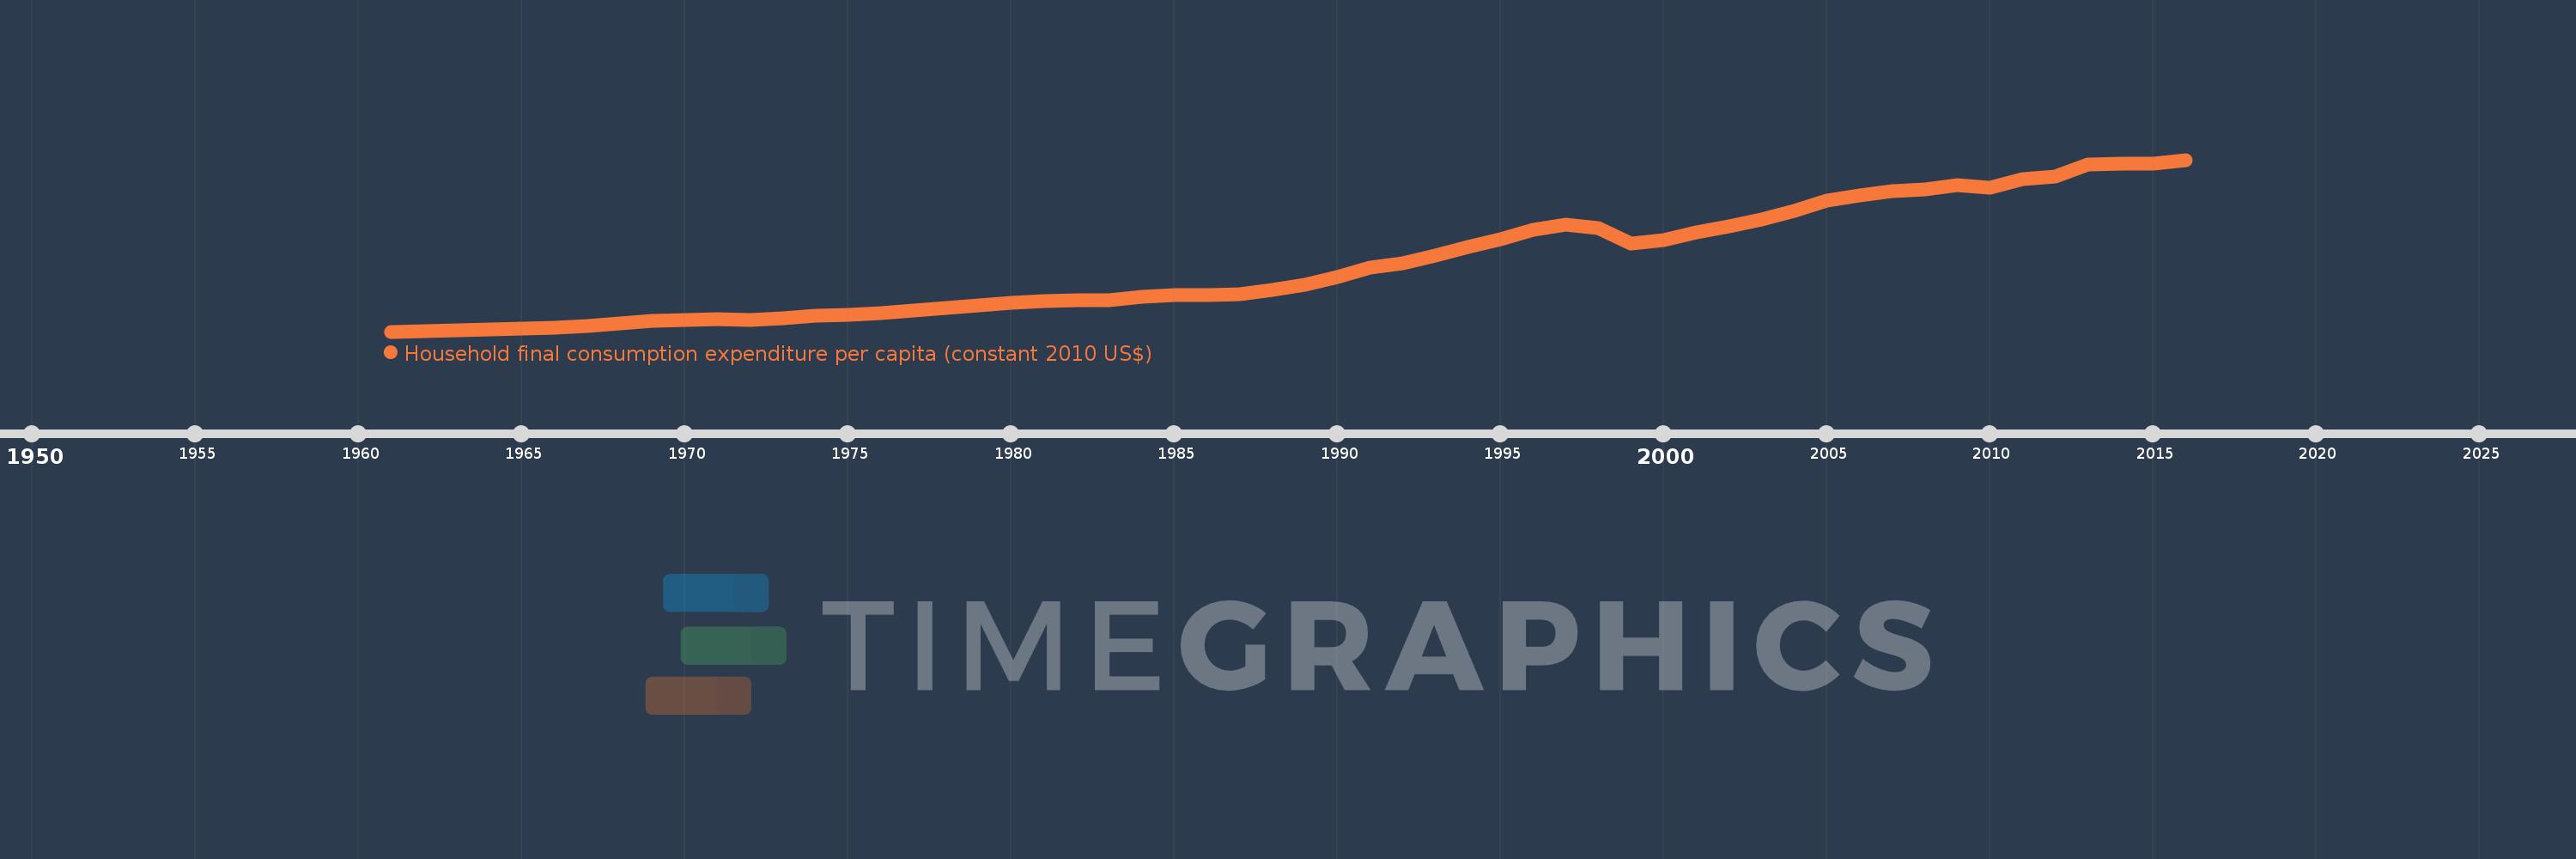
Household final consumption expenditure per capita (constant 2010 US$)
2016,2015,2014,2013,2012,2011,2010,2009,2008,2007,2006,2005,2004,2003,2002,2001,2000,1999,1998,1997,1996,1995,1994,1993,1992,1991,1990,1989,1988,1987,1986,1985,1984,1983,1982,1981,1980,1979,1978,1977,1976,1975,1974,1973,1972,1971,1970,1969,1968,1967,1966,1965,1964,1963,1962,1961
Queste statistiche in altri paesi:
AfghanistanAlbaniaAlgeriaAngolaAntigua and BarbudaArab WorldArgentinaArmeniaArubaAustraliaAustriaAzerbaijanBahamas, TheBahrainBangladeshBarbadosBelarusBelgiumBelizeBeninBermudaBhutanBoliviaBosnia and HerzegovinaBotswanaBrazilBrunei DarussalamBulgariaBurkina FasoBurundiCabo VerdeCambodiaCameroonCanadaCaribbean small statesCentral African RepublicCentral Europe and the BalticsChadChileChinaColombiaComorosCongo, Dem. Rep.Congo, Rep.Costa RicaCote d'IvoireCroatiaCubaCyprusCzech RepublicDenmarkDominicaDominican RepublicEarly-demographic dividendEast Asia & PacificEast Asia & Pacific (excluding high income)East Asia & Pacific (IDA & IBRD countries)EcuadorEgypt, Arab Rep.El SalvadorEquatorial GuineaEritreaEstoniaEuro areaEurope & Central AsiaEurope & Central Asia (excluding high income)Europe & Central Asia (IDA & IBRD countries)European UnionFaroe IslandsFinlandFranceGabonGambia, TheGeorgiaGermanyGhanaGreeceGrenadaGuatemalaGuineaGuinea-BissauGuyanaHaitiHeavily indebted poor countries (HIPC)High incomeHondurasHong Kong SAR, ChinaHungaryIBRD onlyIcelandIDA & IBRD totalIDA blendIDA onlyIDA totalIndiaIndonesiaIran, Islamic Rep.IrelandIsraelItalyJamaicaJapanJordanKazakhstanKenyaKorea, Rep.KosovoKuwaitKyrgyz RepublicLao PDRLate-demographic dividendLatin America & Caribbean Latin America & Caribbean (excluding high income)Latin America & the Caribbean (IDA & IBRD countries)LatviaLeast developed countries: UN classificationLebanonLiberiaLithuaniaLow & middle incomeLow incomeLower middle incomeLuxembourgMacao SAR, ChinaMacedonia, FYRMadagascarMalawiMalaysiaMaliMaltaMauritaniaMauritiusMexicoMiddle East & North AfricaMiddle East & North Africa (excluding high income)Middle East & North Africa (IDA & IBRD countries)Middle incomeMoldovaMongoliaMontenegroMoroccoMozambiqueNamibiaNepalNetherlandsNew ZealandNicaraguaNigerNigeriaNorth AmericaNorwayOECD membersOmanOther small statesPakistanPanamaParaguayPeruPhilippinesPolandPortugalPost-demographic dividendPre-demographic dividendPuerto RicoQatarRomaniaRussian FederationRwandaSaudi ArabiaSenegalSerbiaSeychellesSierra LeoneSingaporeSlovak RepublicSloveniaSmall statesSouth AfricaSouth AsiaSouth Asia (IDA & IBRD)South SudanSpainSri LankaSt. Kitts and NevisSt. LuciaSt. Vincent and the GrenadinesSub-Saharan Africa Sub-Saharan Africa (excluding high income)Sub-Saharan Africa (IDA & IBRD countries)SudanSurinameSwazilandSwedenSwitzerlandTajikistanTanzaniaThailandTimor-LesteTogoTongaTrinidad and TobagoTunisiaTurkeyTurkmenistanUgandaUkraineUnited Arab EmiratesUnited KingdomUnited StatesUpper middle incomeUruguayUzbekistanVanuatuVenezuela, RBVietnamWest Bank and GazaWorldYemen, Rep.ZambiaZimbabwe Linea del tempo:
Questa scala temporale mostra un grafico dal 1961 anno al 2016 anno. Thailand. I dati fino ad 1960 anno non disponibili. Il numero di osservazioni attuali secondo i date: 56.
La fonte (nome):
Indicatori dello sviluppo mondiale
La fonte (organizzazione):
World Bank national accounts data, and OECD National Accounts data files.
Categorie:
Economy & Growth
sono stati aggiornati
23 apr 2017 anni
Indicatori delle variazioni dei valori per anni
Minima:
462.975
1 gen 1961 anni
Massimo:
2.945 Mille.
1 gen 2016 anni
Alla data di osservazione
Valore
Variazione assoluta
La variazione rispetto al valore precedente
1 gen 1961 anni
462.975
+462.975
0.0%
1 gen 1962 anni
463.104
+0.129
0.03%
1 gen 1963 anni
483.523
+20.418
4.41%
1 gen 1964 anni
493.414
+9.891
2.05%
1 gen 1965 anni
506.188
+12.774
2.59%
1 gen 1966 anni
523.864
+17.675
3.49%
1 gen 1967 anni
542.321
+18.458
3.52%
1 gen 1968 anni
580.795
+38.474
7.09%
1 gen 1969 anni
621.534
+40.739
7.01%
1 gen 1970 anni
635.258
+13.723
2.21%
1 gen 1971 anni
641.815
+6.557
1.03%
1 gen 1972 anni
635.041
-6.774
-1.06%
1 gen 1973 anni
656.268
+21.228
3.34%
1 gen 1974 anni
693.605
+37.337
5.69%
1 gen 1975 anni
707.961
+14.356
2.07%
1 gen 1976 anni
727.049
+19.089
2.7%
1 gen 1977 anni
764.689
+37.64
5.18%
1 gen 1978 anni
806.356
+41.667
5.45%
1 gen 1979 anni
838.381
+32.025
3.97%
1 gen 1980 anni
880.636
+42.255
5.04%
1 gen 1981 anni
909.476
+28.84
3.27%
1 gen 1982 anni
911.133
+1.658
0.18%
1 gen 1983 anni
914.065
+2.932
0.32%
1 gen 1984 anni
965.467
+51.401
5.62%
1 gen 1985 anni
990.124
+24.657
2.55%
1 gen 1986 anni
986.263
-3.86
-0.39%
1 gen 1987 anni
1.003 Mille.
+16.521
1.68%
1 gen 1988 anni
1.07 Mille.
+67.168
6.7%
1 gen 1989 anni
1.143 Mille.
+73.437
6.86%
1 gen 1990 anni
1.251 Mille.
+108.1
9.45%
1 gen 1991 anni
1.393 Mille.
+141.952
11.34%
1 gen 1992 anni
1.452 Mille.
+59.035
4.24%
1 gen 1993 anni
1.564 Mille.
+111.696
7.69%
1 gen 1994 anni
1.682 Mille.
+117.821
7.53%
1 gen 1995 anni
1.799 Mille.
+117.484
6.98%
1 gen 1996 anni
1.931 Mille.
+131.121
7.29%
1 gen 1997 anni
2.007 Mille.
+76.42
3.96%
1 gen 1998 anni
1.957 Mille.
-50.068
-2.49%
1 gen 1999 anni
1.737 Mille.
-219.859
-11.23%
1 gen 2000 anni
1.787 Mille.
+49.542
2.85%
1 gen 2001 anni
1.89 Mille.
+103.787
5.81%
1 gen 2002 anni
1.979 Mille.
+88.665
4.69%
1 gen 2003 anni
2.079 Mille.
+99.489
5.03%
1 gen 2004 anni
2.208 Mille.
+129.27
6.22%
1 gen 2005 anni
2.351 Mille.
+142.708
6.46%
1 gen 2006 anni
2.432 Mille.
+81.658
3.47%
1 gen 2007 anni
2.489 Mille.
+56.391
2.32%
1 gen 2008 anni
2.511 Mille.
+22.858
0.92%
1 gen 2009 anni
2.579 Mille.
+67.286
2.68%
1 gen 2010 anni
2.543 Mille.
-35.986
-1.4%
1 gen 2011 anni
2.664 Mille.
+121.374
4.77%
1 gen 2012 anni
2.703 Mille.
+38.489
1.44%
1 gen 2013 anni
2.872 Mille.
+169.392
6.27%
1 gen 2014 anni
2.89 Mille.
+17.704
0.62%
1 gen 2015 anni
2.894 Mille.
+4.163
0.14%
1 gen 2016 anni
2.945 Mille.
+51.593
1.78%
Classificazione dei paesi secondo i statistiche attuali per anni


Commenti: