29
/it/
it
AIzaSyAYiBZKx7MnpbEhh9jyipgxe19OcubqV5w
April 1, 2024
167593
Kenya
KEN
true
2
1
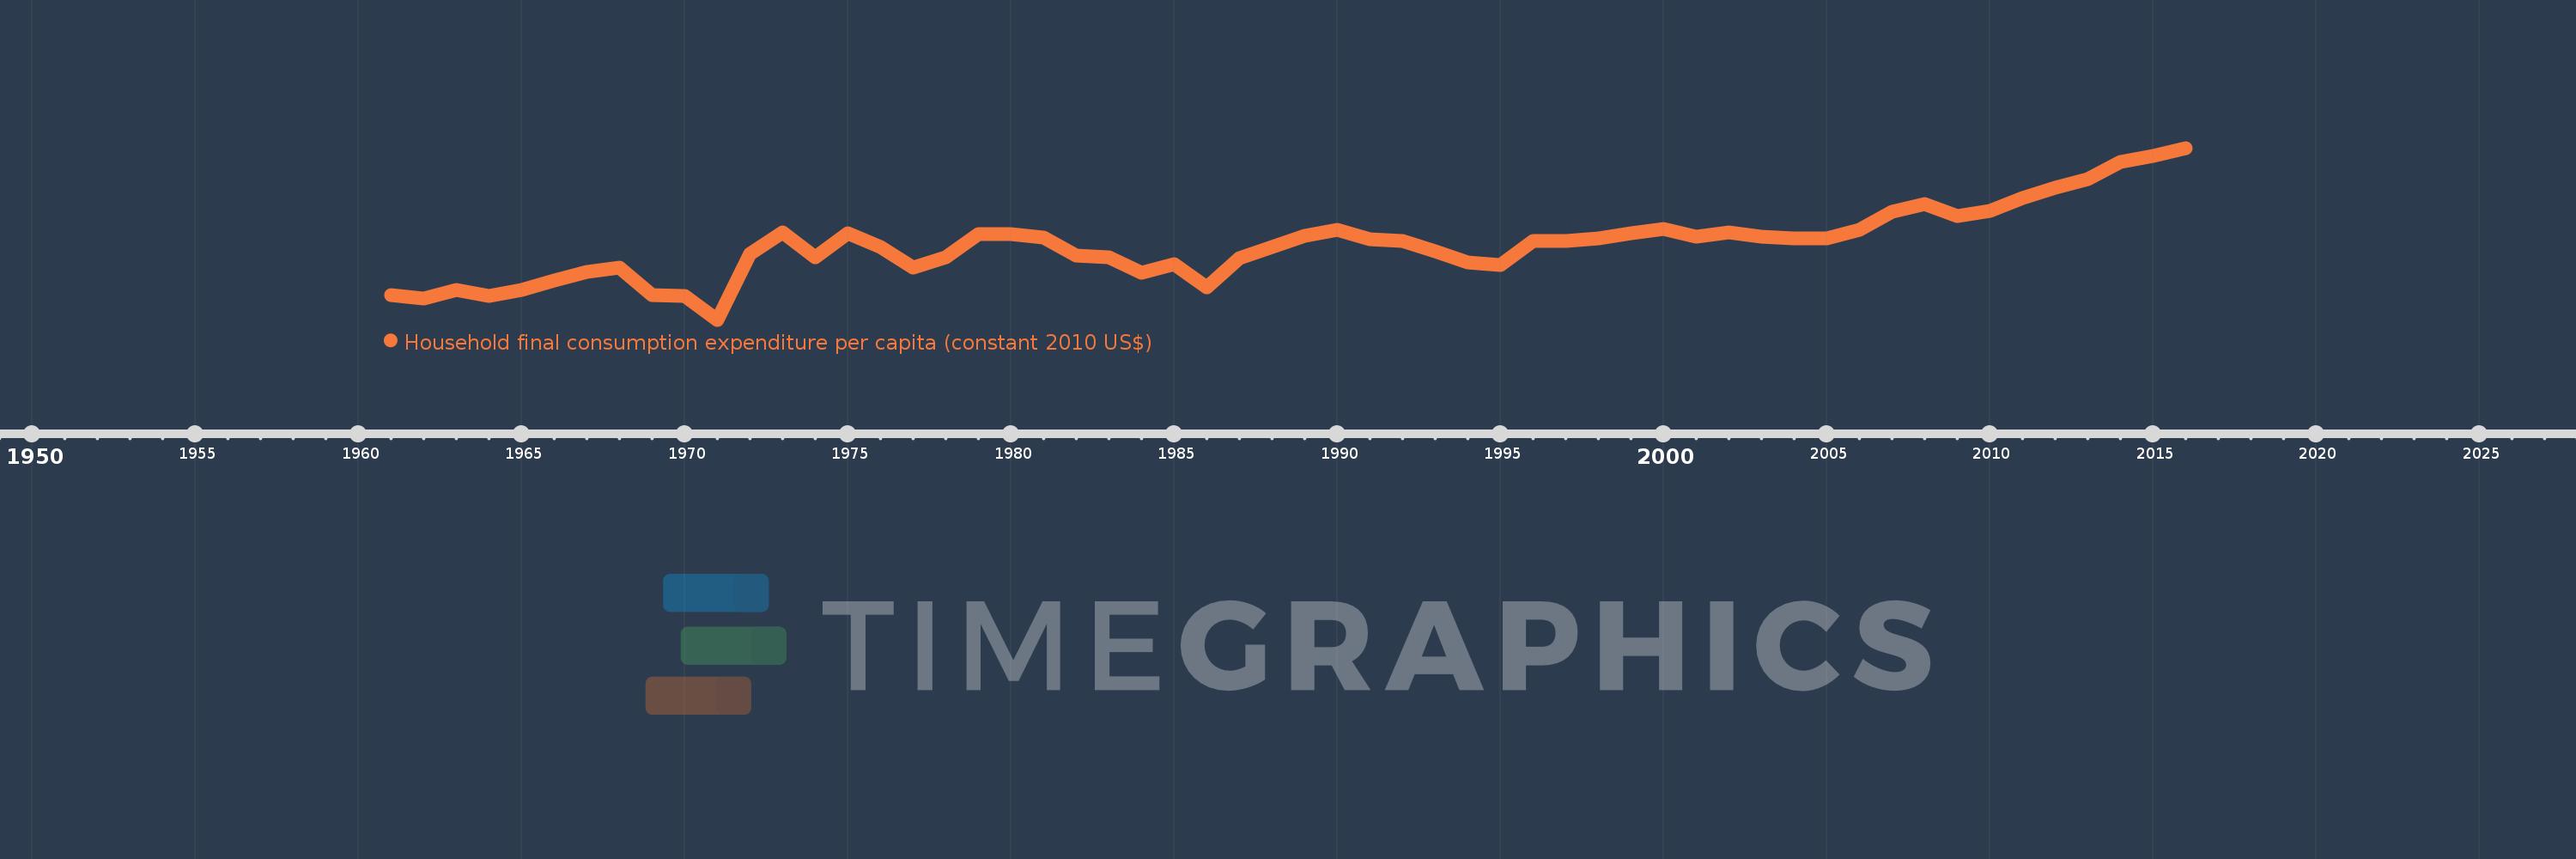
Household final consumption expenditure per capita (constant 2010 US$)
2016,2015,2014,2013,2012,2011,2010,2009,2008,2007,2006,2005,2004,2003,2002,2001,2000,1999,1998,1997,1996,1995,1994,1993,1992,1991,1990,1989,1988,1987,1986,1985,1984,1983,1982,1981,1980,1979,1978,1977,1976,1975,1974,1973,1972,1971,1970,1969,1968,1967,1966,1965,1964,1963,1962,1961
Queste statistiche in altri paesi:
AfghanistanAlbaniaAlgeriaAngolaAntigua and BarbudaArab WorldArgentinaArmeniaArubaAustraliaAustriaAzerbaijanBahamas, TheBahrainBangladeshBarbadosBelarusBelgiumBelizeBeninBermudaBhutanBoliviaBosnia and HerzegovinaBotswanaBrazilBrunei DarussalamBulgariaBurkina FasoBurundiCabo VerdeCambodiaCameroonCanadaCaribbean small statesCentral African RepublicCentral Europe and the BalticsChadChileChinaColombiaComorosCongo, Dem. Rep.Congo, Rep.Costa RicaCote d'IvoireCroatiaCubaCyprusCzech RepublicDenmarkDominicaDominican RepublicEarly-demographic dividendEast Asia & PacificEast Asia & Pacific (excluding high income)East Asia & Pacific (IDA & IBRD countries)EcuadorEgypt, Arab Rep.El SalvadorEquatorial GuineaEritreaEstoniaEuro areaEurope & Central AsiaEurope & Central Asia (excluding high income)Europe & Central Asia (IDA & IBRD countries)European UnionFaroe IslandsFinlandFranceGabonGambia, TheGeorgiaGermanyGhanaGreeceGrenadaGuatemalaGuineaGuinea-BissauGuyanaHaitiHeavily indebted poor countries (HIPC)High incomeHondurasHong Kong SAR, ChinaHungaryIBRD onlyIcelandIDA & IBRD totalIDA blendIDA onlyIDA totalIndiaIndonesiaIran, Islamic Rep.IrelandIsraelItalyJamaicaJapanJordanKazakhstanKenyaKorea, Rep.KosovoKuwaitKyrgyz RepublicLao PDRLate-demographic dividendLatin America & Caribbean Latin America & Caribbean (excluding high income)Latin America & the Caribbean (IDA & IBRD countries)LatviaLeast developed countries: UN classificationLebanonLiberiaLithuaniaLow & middle incomeLow incomeLower middle incomeLuxembourgMacao SAR, ChinaMacedonia, FYRMadagascarMalawiMalaysiaMaliMaltaMauritaniaMauritiusMexicoMiddle East & North AfricaMiddle East & North Africa (excluding high income)Middle East & North Africa (IDA & IBRD countries)Middle incomeMoldovaMongoliaMontenegroMoroccoMozambiqueNamibiaNepalNetherlandsNew ZealandNicaraguaNigerNigeriaNorth AmericaNorwayOECD membersOmanOther small statesPakistanPanamaParaguayPeruPhilippinesPolandPortugalPost-demographic dividendPre-demographic dividendPuerto RicoQatarRomaniaRussian FederationRwandaSaudi ArabiaSenegalSerbiaSeychellesSierra LeoneSingaporeSlovak RepublicSloveniaSmall statesSouth AfricaSouth AsiaSouth Asia (IDA & IBRD)South SudanSpainSri LankaSt. Kitts and NevisSt. LuciaSt. Vincent and the GrenadinesSub-Saharan Africa Sub-Saharan Africa (excluding high income)Sub-Saharan Africa (IDA & IBRD countries)SudanSurinameSwazilandSwedenSwitzerlandTajikistanTanzaniaThailandTimor-LesteTogoTongaTrinidad and TobagoTunisiaTurkeyTurkmenistanUgandaUkraineUnited Arab EmiratesUnited KingdomUnited StatesUpper middle incomeUruguayUzbekistanVanuatuVenezuela, RBVietnamWest Bank and GazaWorldYemen, Rep.ZambiaZimbabwe Linea del tempo:
Questa scala temporale mostra un grafico dal 1961 anno al 2016 anno. Kenya. I dati fino ad 1960 anno non disponibili. Il numero di osservazioni attuali secondo i date: 56.
La fonte (nome):
Indicatori dello sviluppo mondiale
La fonte (organizzazione):
World Bank national accounts data, and OECD National Accounts data files.
Categorie:
Economy & Growth
sono stati aggiornati
23 apr 2017 anni
Indicatori delle variazioni dei valori per anni
Minima:
440.35
1 gen 1971 anni
Massimo:
898.795
1 gen 2016 anni
Alla data di osservazione
Valore
Variazione assoluta
La variazione rispetto al valore precedente
1 gen 1961 anni
505.239
+505.239
0.0%
1 gen 1962 anni
495.874
-9.364
-1.85%
1 gen 1963 anni
518.898
+23.024
4.64%
1 gen 1964 anni
503.243
-15.656
-3.02%
1 gen 1965 anni
520.96
+17.717
3.52%
1 gen 1966 anni
544.244
+23.284
4.47%
1 gen 1967 anni
568.302
+24.058
4.42%
1 gen 1968 anni
578.995
+10.693
1.88%
1 gen 1969 anni
506.195
-72.8
-12.57%
1 gen 1970 anni
503.935
-2.26
-0.45%
1 gen 1971 anni
440.35
-63.585
-12.62%
1 gen 1972 anni
616.08
+175.73
39.91%
1 gen 1973 anni
672.472
+56.392
9.15%
1 gen 1974 anni
605.907
-66.565
-9.9%
1 gen 1975 anni
671.463
+65.555
10.82%
1 gen 1976 anni
634.449
-37.014
-5.51%
1 gen 1977 anni
579.81
-54.639
-8.61%
1 gen 1978 anni
606.105
+26.295
4.54%
1 gen 1979 anni
667.918
+61.813
10.2%
1 gen 1980 anni
668.983
+1.065
0.16%
1 gen 1981 anni
660.087
-8.896
-1.33%
1 gen 1982 anni
611.581
-48.506
-7.35%
1 gen 1983 anni
607.237
-4.344
-0.71%
1 gen 1984 anni
565.507
-41.729
-6.87%
1 gen 1985 anni
587.766
+22.258
3.94%
1 gen 1986 anni
527.672
-60.094
-10.22%
1 gen 1987 anni
605.43
+77.758
14.74%
1 gen 1988 anni
634.708
+29.277
4.84%
1 gen 1989 anni
664.745
+30.037
4.73%
1 gen 1990 anni
680.307
+15.562
2.34%
1 gen 1991 anni
655.824
-24.483
-3.6%
1 gen 1992 anni
649.748
-6.076
-0.93%
1 gen 1993 anni
622.675
-27.073
-4.17%
1 gen 1994 anni
594.19
-28.486
-4.57%
1 gen 1995 anni
587.206
-6.983
-1.18%
1 gen 1996 anni
650.712
+63.506
10.81%
1 gen 1997 anni
649.98
-0.732
-0.11%
1 gen 1998 anni
657.825
+7.845
1.21%
1 gen 1999 anni
671.13
+13.304
2.02%
1 gen 2000 anni
681.655
+10.526
1.57%
1 gen 2001 anni
662.332
-19.323
-2.83%
1 gen 2002 anni
672.539
+10.208
1.54%
1 gen 2003 anni
661.019
-11.52
-1.71%
1 gen 2004 anni
658.281
-2.739
-0.41%
1 gen 2005 anni
656.857
-1.423
-0.22%
1 gen 2006 anni
681.298
+24.441
3.72%
1 gen 2007 anni
729.578
+48.28
7.09%
1 gen 2008 anni
748.323
+18.746
2.57%
1 gen 2009 anni
717.804
-30.519
-4.08%
1 gen 2010 anni
731.139
+13.335
1.86%
1 gen 2011 anni
765.268
+34.129
4.67%
1 gen 2012 anni
791.88
+26.611
3.48%
1 gen 2013 anni
814.902
+23.022
2.91%
1 gen 2014 anni
860.513
+45.611
5.6%
1 gen 2015 anni
876.462
+15.95
1.85%
1 gen 2016 anni
898.795
+22.333
2.55%
Classificazione dei paesi secondo i statistiche attuali per anni


Commenti: