29
/it/
it
AIzaSyAYiBZKx7MnpbEhh9jyipgxe19OcubqV5w
April 1, 2024
231141
Rwanda
RWA
true
2
1
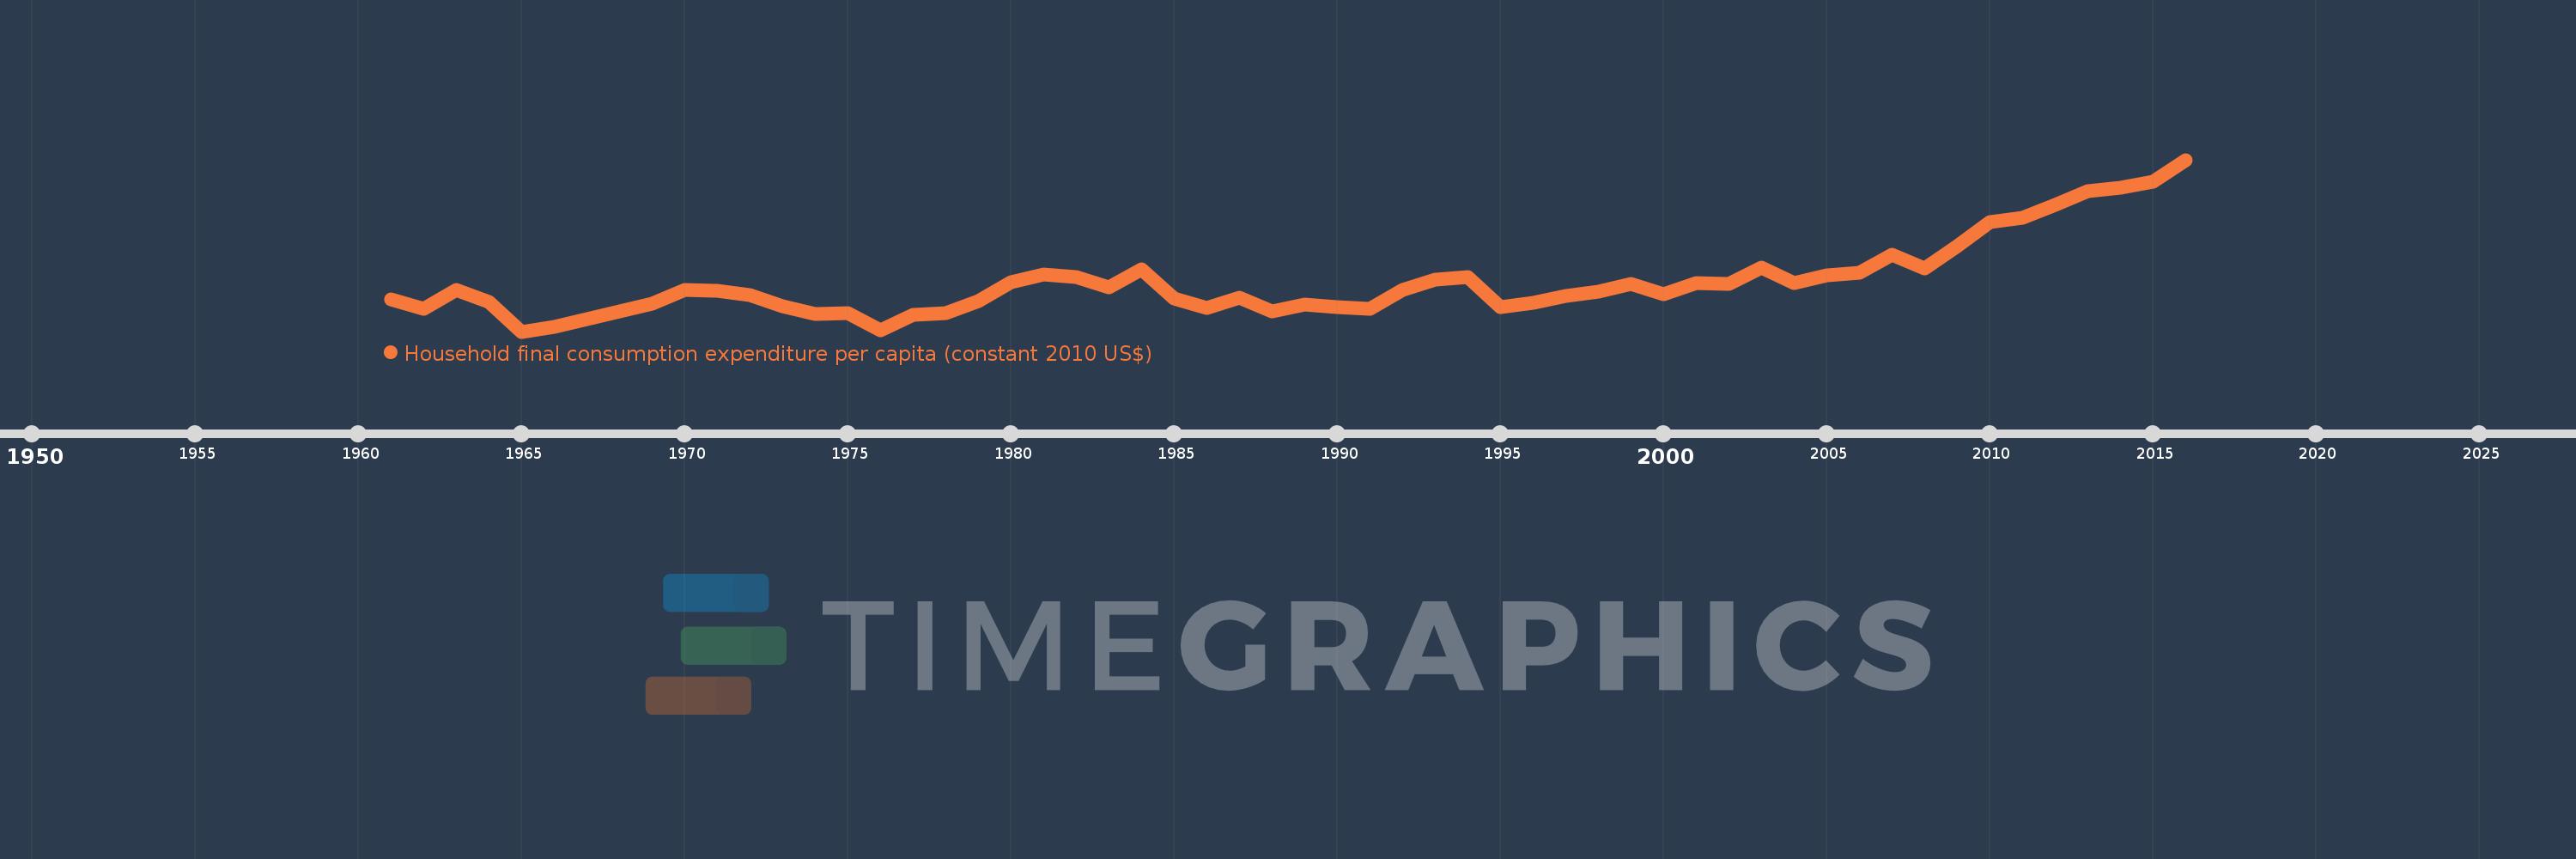
Household final consumption expenditure per capita (constant 2010 US$)
2016,2015,2014,2013,2012,2011,2010,2009,2008,2007,2006,2005,2004,2003,2002,2001,2000,1999,1998,1997,1996,1995,1994,1993,1992,1991,1990,1989,1988,1987,1986,1985,1984,1983,1982,1981,1980,1979,1978,1977,1976,1975,1974,1973,1972,1971,1970,1969,1968,1967,1966,1965,1964,1963,1962,1961
Queste statistiche in altri paesi:
AfghanistanAlbaniaAlgeriaAngolaAntigua and BarbudaArab WorldArgentinaArmeniaArubaAustraliaAustriaAzerbaijanBahamas, TheBahrainBangladeshBarbadosBelarusBelgiumBelizeBeninBermudaBhutanBoliviaBosnia and HerzegovinaBotswanaBrazilBrunei DarussalamBulgariaBurkina FasoBurundiCabo VerdeCambodiaCameroonCanadaCaribbean small statesCentral African RepublicCentral Europe and the BalticsChadChileChinaColombiaComorosCongo, Dem. Rep.Congo, Rep.Costa RicaCote d'IvoireCroatiaCubaCyprusCzech RepublicDenmarkDominicaDominican RepublicEarly-demographic dividendEast Asia & PacificEast Asia & Pacific (excluding high income)East Asia & Pacific (IDA & IBRD countries)EcuadorEgypt, Arab Rep.El SalvadorEquatorial GuineaEritreaEstoniaEuro areaEurope & Central AsiaEurope & Central Asia (excluding high income)Europe & Central Asia (IDA & IBRD countries)European UnionFaroe IslandsFinlandFranceGabonGambia, TheGeorgiaGermanyGhanaGreeceGrenadaGuatemalaGuineaGuinea-BissauGuyanaHaitiHeavily indebted poor countries (HIPC)High incomeHondurasHong Kong SAR, ChinaHungaryIBRD onlyIcelandIDA & IBRD totalIDA blendIDA onlyIDA totalIndiaIndonesiaIran, Islamic Rep.IrelandIsraelItalyJamaicaJapanJordanKazakhstanKenyaKorea, Rep.KosovoKuwaitKyrgyz RepublicLao PDRLate-demographic dividendLatin America & Caribbean Latin America & Caribbean (excluding high income)Latin America & the Caribbean (IDA & IBRD countries)LatviaLeast developed countries: UN classificationLebanonLiberiaLithuaniaLow & middle incomeLow incomeLower middle incomeLuxembourgMacao SAR, ChinaMacedonia, FYRMadagascarMalawiMalaysiaMaliMaltaMauritaniaMauritiusMexicoMiddle East & North AfricaMiddle East & North Africa (excluding high income)Middle East & North Africa (IDA & IBRD countries)Middle incomeMoldovaMongoliaMontenegroMoroccoMozambiqueNamibiaNepalNetherlandsNew ZealandNicaraguaNigerNigeriaNorth AmericaNorwayOECD membersOmanOther small statesPakistanPanamaParaguayPeruPhilippinesPolandPortugalPost-demographic dividendPre-demographic dividendPuerto RicoQatarRomaniaRussian FederationRwandaSaudi ArabiaSenegalSerbiaSeychellesSierra LeoneSingaporeSlovak RepublicSloveniaSmall statesSouth AfricaSouth AsiaSouth Asia (IDA & IBRD)South SudanSpainSri LankaSt. Kitts and NevisSt. LuciaSt. Vincent and the GrenadinesSub-Saharan Africa Sub-Saharan Africa (excluding high income)Sub-Saharan Africa (IDA & IBRD countries)SudanSurinameSwazilandSwedenSwitzerlandTajikistanTanzaniaThailandTimor-LesteTogoTongaTrinidad and TobagoTunisiaTurkeyTurkmenistanUgandaUkraineUnited Arab EmiratesUnited KingdomUnited StatesUpper middle incomeUruguayUzbekistanVanuatuVenezuela, RBVietnamWest Bank and GazaWorldYemen, Rep.ZambiaZimbabwe Linea del tempo:
Questa scala temporale mostra un grafico dal 1961 anno al 2016 anno. Rwanda. I dati fino ad 1960 anno non disponibili. Il numero di osservazioni attuali secondo i date: 56.
La fonte (nome):
Indicatori dello sviluppo mondiale
La fonte (organizzazione):
World Bank national accounts data, and OECD National Accounts data files.
Categorie:
Economy & Growth
sono stati aggiornati
23 apr 2017 anni
Indicatori delle variazioni dei valori per anni
Minima:
215.431
1 gen 1965 anni
Massimo:
539.368
1 gen 2016 anni
Alla data di osservazione
Valore
Variazione assoluta
La variazione rispetto al valore precedente
1 gen 1961 anni
275.981
+275.981
0.0%
1 gen 1962 anni
258.999
-16.982
-6.15%
1 gen 1963 anni
294.72
+35.722
13.79%
1 gen 1964 anni
270.545
-24.176
-8.2%
1 gen 1965 anni
215.431
-55.113
-20.37%
1 gen 1966 anni
223.726
+8.295
3.85%
1 gen 1967 anni
239.065
+15.339
6.86%
1 gen 1968 anni
253.491
+14.425
6.03%
1 gen 1969 anni
267.704
+14.214
5.61%
1 gen 1970 anni
293.502
+25.798
9.64%
1 gen 1971 anni
292.505
-0.997
-0.34%
1 gen 1972 anni
284.949
-7.556
-2.58%
1 gen 1973 anni
262.966
-21.983
-7.71%
1 gen 1974 anni
248.303
-14.663
-5.58%
1 gen 1975 anni
250.838
+2.535
1.02%
1 gen 1976 anni
217.052
-33.786
-13.47%
1 gen 1977 anni
246.925
+29.873
13.76%
1 gen 1978 anni
250.943
+4.018
1.63%
1 gen 1979 anni
273.544
+22.601
9.01%
1 gen 1980 anni
308.969
+35.425
12.95%
1 gen 1981 anni
323.366
+14.397
4.66%
1 gen 1982 anni
318.036
-5.33
-1.65%
1 gen 1983 anni
299.487
-18.548
-5.83%
1 gen 1984 anni
332.576
+33.089
11.05%
1 gen 1985 anni
277.717
-54.859
-16.5%
1 gen 1986 anni
260.771
-16.946
-6.1%
1 gen 1987 anni
280.191
+19.42
7.45%
1 gen 1988 anni
252.938
-27.253
-9.73%
1 gen 1989 anni
267.226
+14.289
5.65%
1 gen 1990 anni
261.679
-5.548
-2.08%
1 gen 1991 anni
257.812
-3.867
-1.48%
1 gen 1992 anni
294.429
+36.617
14.2%
1 gen 1993 anni
314.017
+19.588
6.65%
1 gen 1994 anni
318.334
+4.317
1.37%
1 gen 1995 anni
262.325
-56.009
-17.59%
1 gen 1996 anni
270.273
+7.948
3.03%
1 gen 1997 anni
282.598
+12.325
4.56%
1 gen 1998 anni
290.975
+8.377
2.96%
1 gen 1999 anni
305.627
+14.651
5.04%
1 gen 2000 anni
286.656
-18.971
-6.21%
1 gen 2001 anni
306.754
+20.098
7.01%
1 gen 2002 anni
304.781
-1.973
-0.64%
1 gen 2003 anni
336.657
+31.876
10.46%
1 gen 2004 anni
307.366
-29.291
-8.7%
1 gen 2005 anni
321.141
+13.775
4.48%
1 gen 2006 anni
327.12
+5.978
1.86%
1 gen 2007 anni
360.688
+33.569
10.26%
1 gen 2008 anni
333.947
-26.742
-7.41%
1 gen 2009 anni
376.301
+42.354
12.68%
1 gen 2010 anni
421.441
+45.14
12.0%
1 gen 2011 anni
430.65
+9.209
2.19%
1 gen 2012 anni
455.127
+24.477
5.68%
1 gen 2013 anni
480.865
+25.738
5.66%
1 gen 2014 anni
486.317
+5.451
1.13%
1 gen 2015 anni
497.755
+11.438
2.35%
1 gen 2016 anni
539.368
+41.614
8.36%
Classificazione dei paesi secondo i statistiche attuali per anni


Commenti: