29
/it/
it
AIzaSyAYiBZKx7MnpbEhh9jyipgxe19OcubqV5w
April 1, 2024
256921
Sweden
SWE
true
2
1
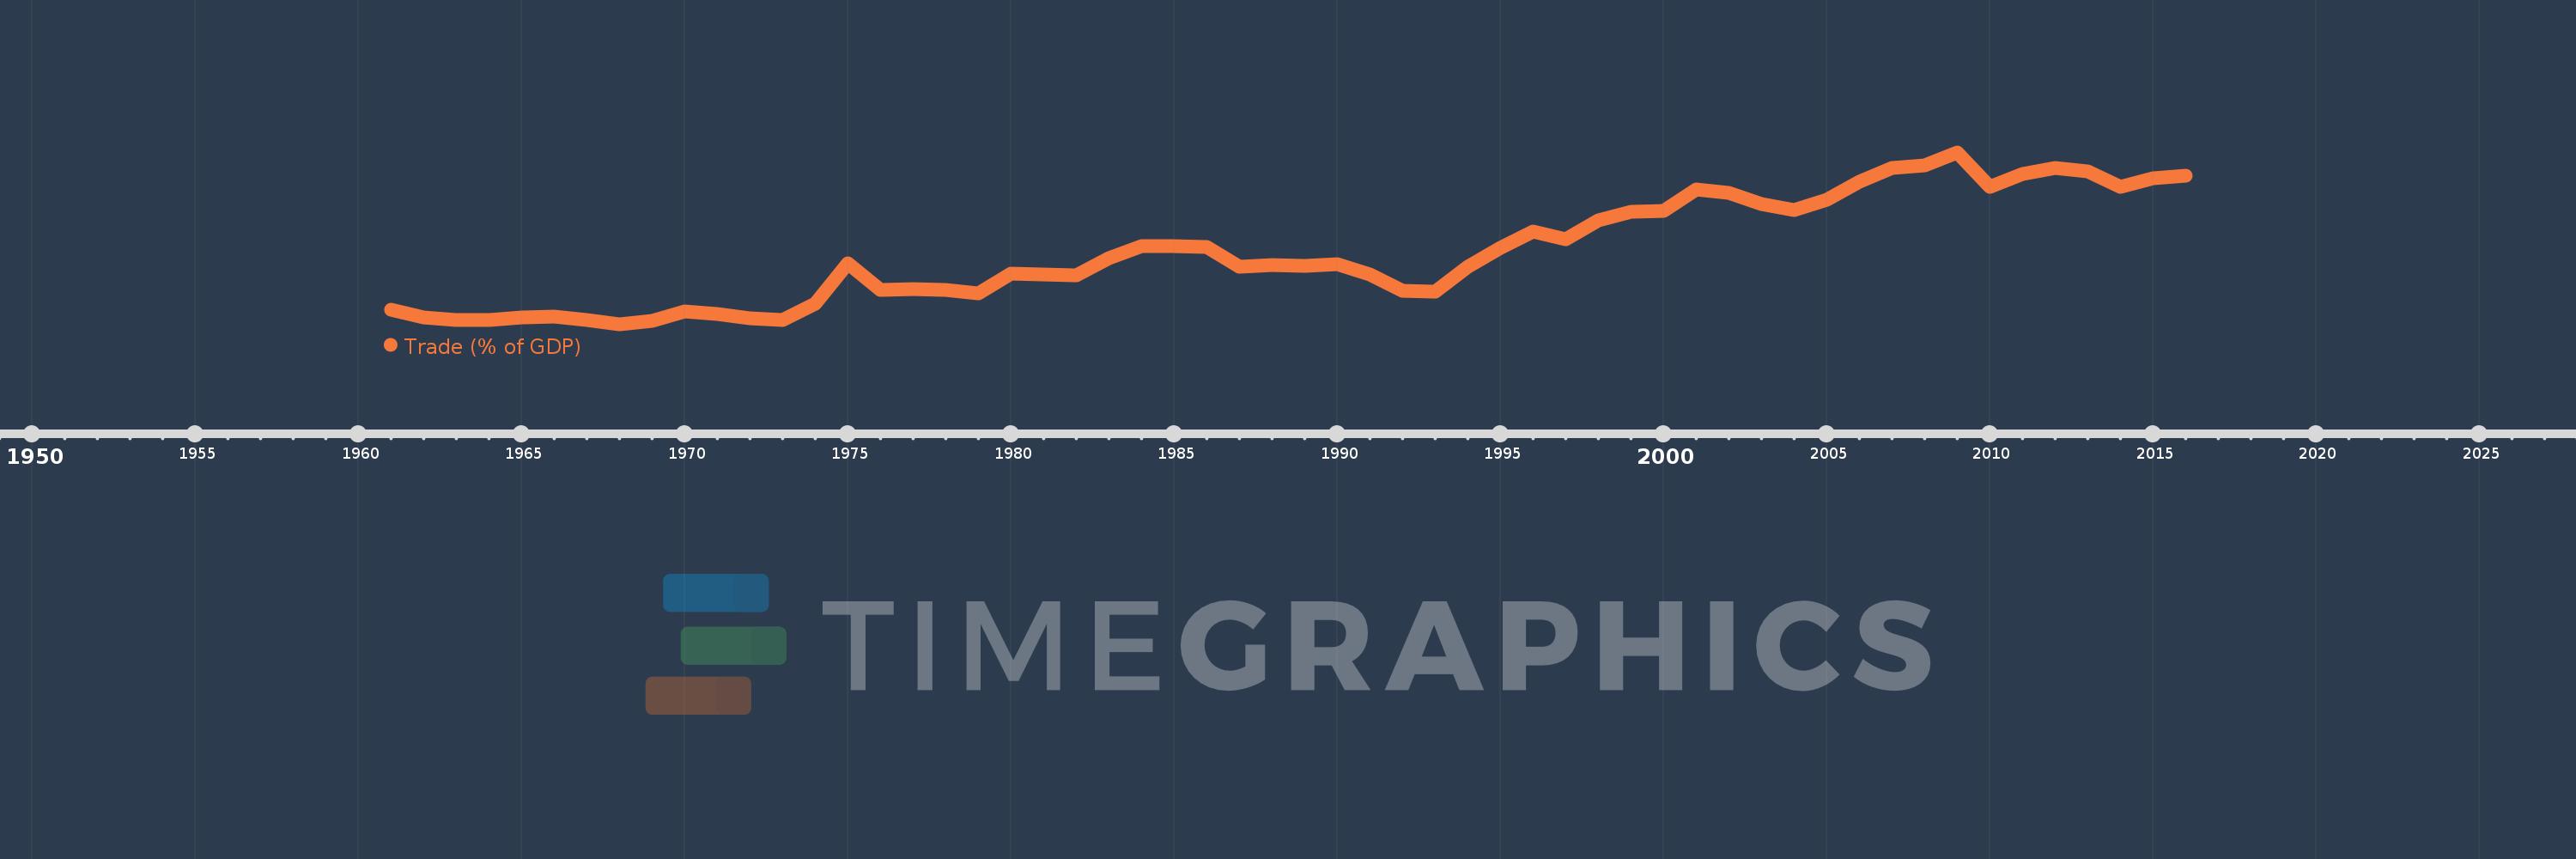
Trade (% of GDP)
2016,2015,2014,2013,2012,2011,2010,2009,2008,2007,2006,2005,2004,2003,2002,2001,2000,1999,1998,1997,1996,1995,1994,1993,1992,1991,1990,1989,1988,1987,1986,1985,1984,1983,1982,1981,1980,1979,1978,1977,1976,1975,1974,1973,1972,1971,1970,1969,1968,1967,1966,1965,1964,1963,1962,1961
Queste statistiche in altri paesi:
AfghanistanAlbaniaAlgeriaAngolaAntigua and BarbudaArab WorldArgentinaArmeniaArubaAustraliaAustriaAzerbaijanBahamas, TheBahrainBangladeshBarbadosBelarusBelgiumBelizeBeninBermudaBhutanBoliviaBosnia and HerzegovinaBotswanaBrazilBrunei DarussalamBulgariaBurkina FasoBurundiCabo VerdeCambodiaCameroonCanadaCaribbean small statesCentral African RepublicCentral Europe and the BalticsChadChileChinaColombiaComorosCongo, Dem. Rep.Congo, Rep.Costa RicaCote d'IvoireCroatiaCubaCyprusCzech RepublicDenmarkDjiboutiDominicaDominican RepublicEarly-demographic dividendEast Asia & PacificEast Asia & Pacific (excluding high income)East Asia & Pacific (IDA & IBRD countries)EcuadorEgypt, Arab Rep.El SalvadorEquatorial GuineaEritreaEstoniaEthiopiaEuro areaEurope & Central AsiaEurope & Central Asia (excluding high income)Europe & Central Asia (IDA & IBRD countries)European UnionFaroe IslandsFijiFinlandFragile and conflict affected situationsFranceFrench PolynesiaGabonGambia, TheGeorgiaGermanyGhanaGreeceGrenadaGuatemalaGuineaGuinea-BissauGuyanaHaitiHeavily indebted poor countries (HIPC)High incomeHondurasHong Kong SAR, ChinaHungaryIBRD onlyIcelandIDA & IBRD totalIDA blendIDA onlyIDA totalIndiaIndonesiaIran, Islamic Rep.IraqIrelandIsraelItalyJamaicaJapanJordanKazakhstanKenyaKiribatiKorea, Rep.KosovoKuwaitKyrgyz RepublicLao PDRLate-demographic dividendLatin America & Caribbean Latin America & Caribbean (excluding high income)Latin America & the Caribbean (IDA & IBRD countries)LatviaLeast developed countries: UN classificationLebanonLesothoLiberiaLibyaLithuaniaLow & middle incomeLow incomeLower middle incomeLuxembourgMacao SAR, ChinaMacedonia, FYRMadagascarMalawiMalaysiaMaldivesMaliMaltaMauritaniaMauritiusMexicoMicronesia, Fed. Sts.Middle East & North AfricaMiddle East & North Africa (excluding high income)Middle East & North Africa (IDA & IBRD countries)Middle incomeMoldovaMongoliaMontenegroMoroccoMozambiqueMyanmarNamibiaNepalNetherlandsNew CaledoniaNew ZealandNicaraguaNigerNigeriaNorth AmericaNorwayOECD membersOmanOther small statesPacific island small statesPakistanPalauPanamaPapua New GuineaParaguayPeruPhilippinesPolandPortugalPost-demographic dividendPre-demographic dividendPuerto RicoQatarRomaniaRussian FederationRwandaSamoaSaudi ArabiaSenegalSerbiaSeychellesSierra LeoneSingaporeSlovak RepublicSloveniaSmall statesSolomon IslandsSomaliaSouth AfricaSouth AsiaSouth Asia (IDA & IBRD)South SudanSpainSri LankaSt. Kitts and NevisSt. LuciaSt. Vincent and the GrenadinesSub-Saharan Africa Sub-Saharan Africa (excluding high income)Sub-Saharan Africa (IDA & IBRD countries)SudanSurinameSwazilandSwedenSwitzerlandSyrian Arab RepublicTajikistanTanzaniaThailandTimor-LesteTogoTongaTrinidad and TobagoTunisiaTurkeyTurkmenistanUgandaUkraineUnited Arab EmiratesUnited KingdomUnited StatesUpper middle incomeUruguayUzbekistanVanuatuVenezuela, RBVietnamWest Bank and GazaWorldYemen, Rep.ZambiaZimbabwe Linea del tempo:
Questa scala temporale mostra un grafico dal 1961 anno al 2016 anno. Sweden. I dati fino ad 1960 anno non disponibili. Il numero di osservazioni attuali secondo i date: 56.
La fonte (nome):
Indicatori dello sviluppo mondiale
La fonte (organizzazione):
World Bank national accounts data, and OECD National Accounts data files.
Categorie:
Economy & Growth, Trade
sono stati aggiornati
23 apr 2017 anni
Indicatori delle variazioni dei valori per anni
Minima:
42.098
1 gen 1968 anni
Massimo:
93.359
1 gen 2009 anni
Alla data di osservazione
Valore
Variazione assoluta
La variazione rispetto al valore precedente
1 gen 1961 anni
46.441
+46.441
0.0%
1 gen 1962 anni
44.035
-2.407
-5.18%
1 gen 1963 anni
43.297
-0.737
-1.67%
1 gen 1964 anni
43.461
+0.164
0.38%
1 gen 1965 anni
44.216
+0.755
1.74%
1 gen 1966 anni
44.4
+0.185
0.42%
1 gen 1967 anni
43.355
-1.045
-2.35%
1 gen 1968 anni
42.098
-1.257
-2.9%
1 gen 1969 anni
43.149
+1.05
2.49%
1 gen 1970 anni
45.881
+2.733
6.33%
1 gen 1971 anni
45.113
-0.768
-1.67%
1 gen 1972 anni
43.985
-1.128
-2.5%
1 gen 1973 anni
43.393
-0.591
-1.34%
1 gen 1974 anni
48.203
+4.81
11.08%
1 gen 1975 anni
60.312
+12.109
25.12%
1 gen 1976 anni
52.281
-8.032
-13.32%
1 gen 1977 anni
52.702
+0.421
0.81%
1 gen 1978 anni
52.214
-0.487
-0.92%
1 gen 1979 anni
51.302
-0.912
-1.75%
1 gen 1980 anni
57.185
+5.882
11.47%
1 gen 1981 anni
56.896
-0.288
-0.5%
1 gen 1982 anni
56.773
-0.123
-0.22%
1 gen 1983 anni
61.775
+5.002
8.81%
1 gen 1984 anni
65.501
+3.727
6.03%
1 gen 1985 anni
65.389
-0.112
-0.17%
1 gen 1986 anni
65.188
-0.202
-0.31%
1 gen 1987 anni
59.339
-5.849
-8.97%
1 gen 1988 anni
59.779
+0.441
0.74%
1 gen 1989 anni
59.441
-0.339
-0.57%
1 gen 1990 anni
60.132
+0.691
1.16%
1 gen 1991 anni
56.857
-3.275
-5.45%
1 gen 1992 anni
52.047
-4.809
-8.46%
1 gen 1993 anni
51.725
-0.323
-0.62%
1 gen 1994 anni
59.241
+7.516
14.53%
1 gen 1995 anni
64.927
+5.686
9.6%
1 gen 1996 anni
69.627
+4.7
7.24%
1 gen 1997 anni
67.489
-2.138
-3.07%
1 gen 1998 anni
73.154
+5.666
8.39%
1 gen 1999 anni
75.744
+2.59
3.54%
1 gen 2000 anni
76.009
+0.266
0.35%
1 gen 2001 anni
82.327
+6.318
8.31%
1 gen 2002 anni
81.276
-1.051
-1.28%
1 gen 2003 anni
77.864
-3.413
-4.2%
1 gen 2004 anni
76.148
-1.715
-2.2%
1 gen 2005 anni
79.294
+3.146
4.13%
1 gen 2006 anni
84.574
+5.28
6.66%
1 gen 2007 anni
88.789
+4.216
4.98%
1 gen 2008 anni
89.54
+0.75
0.85%
1 gen 2009 anni
93.359
+3.819
4.27%
1 gen 2010 anni
83.143
-10.216
-10.94%
1 gen 2011 anni
86.903
+3.76
4.52%
1 gen 2012 anni
88.662
+1.759
2.02%
1 gen 2013 anni
87.715
-0.947
-1.07%
1 gen 2014 anni
83.094
-4.621
-5.27%
1 gen 2015 anni
85.751
+2.657
3.2%
1 gen 2016 anni
86.446
+0.695
0.81%
Classificazione dei paesi secondo i statistiche attuali per anni


Commenti: