29
/it/
it
AIzaSyAYiBZKx7MnpbEhh9jyipgxe19OcubqV5w
April 1, 2024
174895
Lao PDR
LAO
true
2
1
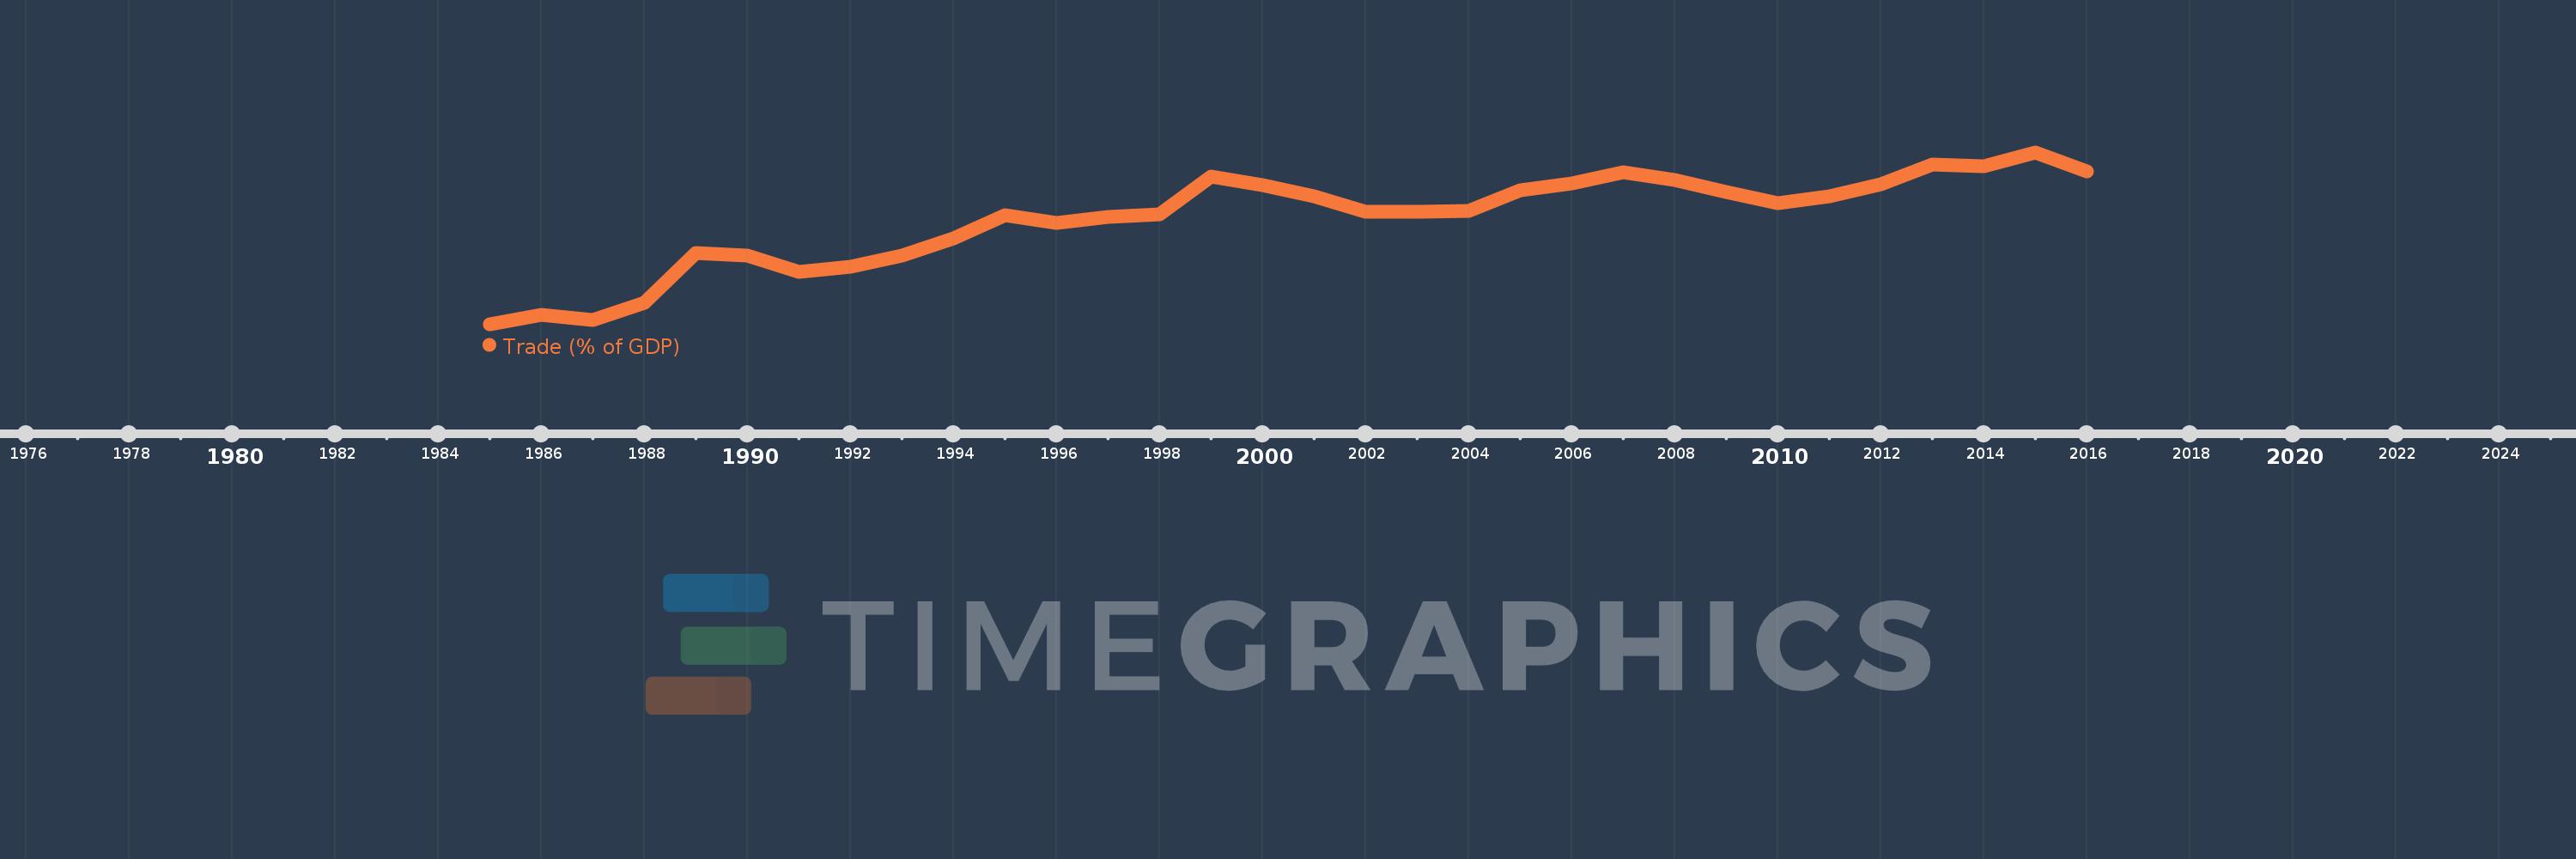
Trade (% of GDP)
2016,2015,2014,2013,2012,2011,2010,2009,2008,2007,2006,2005,2004,2003,2002,2001,2000,1999,1998,1997,1996,1995,1994,1993,1992,1991,1990,1989,1988,1987,1986,1985
Queste statistiche in altri paesi:
AfghanistanAlbaniaAlgeriaAngolaAntigua and BarbudaArab WorldArgentinaArmeniaArubaAustraliaAustriaAzerbaijanBahamas, TheBahrainBangladeshBarbadosBelarusBelgiumBelizeBeninBermudaBhutanBoliviaBosnia and HerzegovinaBotswanaBrazilBrunei DarussalamBulgariaBurkina FasoBurundiCabo VerdeCambodiaCameroonCanadaCaribbean small statesCentral African RepublicCentral Europe and the BalticsChadChileChinaColombiaComorosCongo, Dem. Rep.Congo, Rep.Costa RicaCote d'IvoireCroatiaCubaCyprusCzech RepublicDenmarkDjiboutiDominicaDominican RepublicEarly-demographic dividendEast Asia & PacificEast Asia & Pacific (excluding high income)East Asia & Pacific (IDA & IBRD countries)EcuadorEgypt, Arab Rep.El SalvadorEquatorial GuineaEritreaEstoniaEthiopiaEuro areaEurope & Central AsiaEurope & Central Asia (excluding high income)Europe & Central Asia (IDA & IBRD countries)European UnionFaroe IslandsFijiFinlandFragile and conflict affected situationsFranceFrench PolynesiaGabonGambia, TheGeorgiaGermanyGhanaGreeceGrenadaGuatemalaGuineaGuinea-BissauGuyanaHaitiHeavily indebted poor countries (HIPC)High incomeHondurasHong Kong SAR, ChinaHungaryIBRD onlyIcelandIDA & IBRD totalIDA blendIDA onlyIDA totalIndiaIndonesiaIran, Islamic Rep.IraqIrelandIsraelItalyJamaicaJapanJordanKazakhstanKenyaKiribatiKorea, Rep.KosovoKuwaitKyrgyz RepublicLao PDRLate-demographic dividendLatin America & Caribbean Latin America & Caribbean (excluding high income)Latin America & the Caribbean (IDA & IBRD countries)LatviaLeast developed countries: UN classificationLebanonLesothoLiberiaLibyaLithuaniaLow & middle incomeLow incomeLower middle incomeLuxembourgMacao SAR, ChinaMacedonia, FYRMadagascarMalawiMalaysiaMaldivesMaliMaltaMauritaniaMauritiusMexicoMicronesia, Fed. Sts.Middle East & North AfricaMiddle East & North Africa (excluding high income)Middle East & North Africa (IDA & IBRD countries)Middle incomeMoldovaMongoliaMontenegroMoroccoMozambiqueMyanmarNamibiaNepalNetherlandsNew CaledoniaNew ZealandNicaraguaNigerNigeriaNorth AmericaNorwayOECD membersOmanOther small statesPacific island small statesPakistanPalauPanamaPapua New GuineaParaguayPeruPhilippinesPolandPortugalPost-demographic dividendPre-demographic dividendPuerto RicoQatarRomaniaRussian FederationRwandaSamoaSaudi ArabiaSenegalSerbiaSeychellesSierra LeoneSingaporeSlovak RepublicSloveniaSmall statesSolomon IslandsSomaliaSouth AfricaSouth AsiaSouth Asia (IDA & IBRD)South SudanSpainSri LankaSt. Kitts and NevisSt. LuciaSt. Vincent and the GrenadinesSub-Saharan Africa Sub-Saharan Africa (excluding high income)Sub-Saharan Africa (IDA & IBRD countries)SudanSurinameSwazilandSwedenSwitzerlandSyrian Arab RepublicTajikistanTanzaniaThailandTimor-LesteTogoTongaTrinidad and TobagoTunisiaTurkeyTurkmenistanUgandaUkraineUnited Arab EmiratesUnited KingdomUnited StatesUpper middle incomeUruguayUzbekistanVanuatuVenezuela, RBVietnamWest Bank and GazaWorldYemen, Rep.ZambiaZimbabwe Linea del tempo:
Questa scala temporale mostra un grafico dal 1985 anno al 2016 anno. Lao PDR. I dati fino ad 1984 anno non disponibili. Il numero di osservazioni attuali secondo i date: 32.
La fonte (nome):
Indicatori dello sviluppo mondiale
La fonte (organizzazione):
World Bank national accounts data, and OECD National Accounts data files.
Categorie:
Economy & Growth, Trade
sono stati aggiornati
23 apr 2017 anni
Indicatori delle variazioni dei valori per anni
Minima:
9.106
1 gen 1985 anni
Massimo:
96.617
1 gen 2015 anni
Alla data di osservazione
Valore
Variazione assoluta
La variazione rispetto al valore precedente
1 gen 1985 anni
9.106
+9.106
0.0%
1 gen 1986 anni
13.803
+4.697
51.58%
1 gen 1987 anni
11.315
-2.488
-18.02%
1 gen 1988 anni
20.116
+8.8
77.78%
1 gen 1989 anni
45.528
+25.413
126.33%
1 gen 1990 anni
44.127
-1.401
-3.08%
1 gen 1991 anni
35.847
-8.28
-18.76%
1 gen 1992 anni
38.182
+2.335
6.51%
1 gen 1993 anni
44.131
+5.948
15.58%
1 gen 1994 anni
52.629
+8.498
19.26%
1 gen 1995 anni
64.809
+12.18
23.14%
1 gen 1996 anni
60.554
-4.255
-6.57%
1 gen 1997 anni
63.757
+3.203
5.29%
1 gen 1998 anni
65.157
+1.4
2.2%
1 gen 1999 anni
84.27
+19.113
29.33%
1 gen 2000 anni
80.058
-4.211
-5.0%
1 gen 2001 anni
74.31
-5.748
-7.18%
1 gen 2002 anni
66.298
-8.012
-10.78%
1 gen 2003 anni
66.279
-0.019
-0.03%
1 gen 2004 anni
66.732
+0.454
0.68%
1 gen 2005 anni
77.507
+10.775
16.15%
1 gen 2006 anni
80.657
+3.15
4.06%
1 gen 2007 anni
86.321
+5.664
7.02%
1 gen 2008 anni
82.457
-3.864
-4.48%
1 gen 2009 anni
76.228
-6.229
-7.55%
1 gen 2010 anni
70.973
-5.256
-6.89%
1 gen 2011 anni
74.217
+3.245
4.57%
1 gen 2012 anni
80.573
+6.356
8.56%
1 gen 2013 anni
90.48
+9.906
12.29%
1 gen 2014 anni
89.747
-0.732
-0.81%
1 gen 2015 anni
96.617
+6.87
7.65%
1 gen 2016 anni
86.969
-9.648
-9.99%
Classificazione dei paesi secondo i statistiche attuali per anni


Commenti: