29
/it/
it
AIzaSyAYiBZKx7MnpbEhh9jyipgxe19OcubqV5w
April 1, 2024
110453
Congo, Dem. Rep.
COD
true
2
1
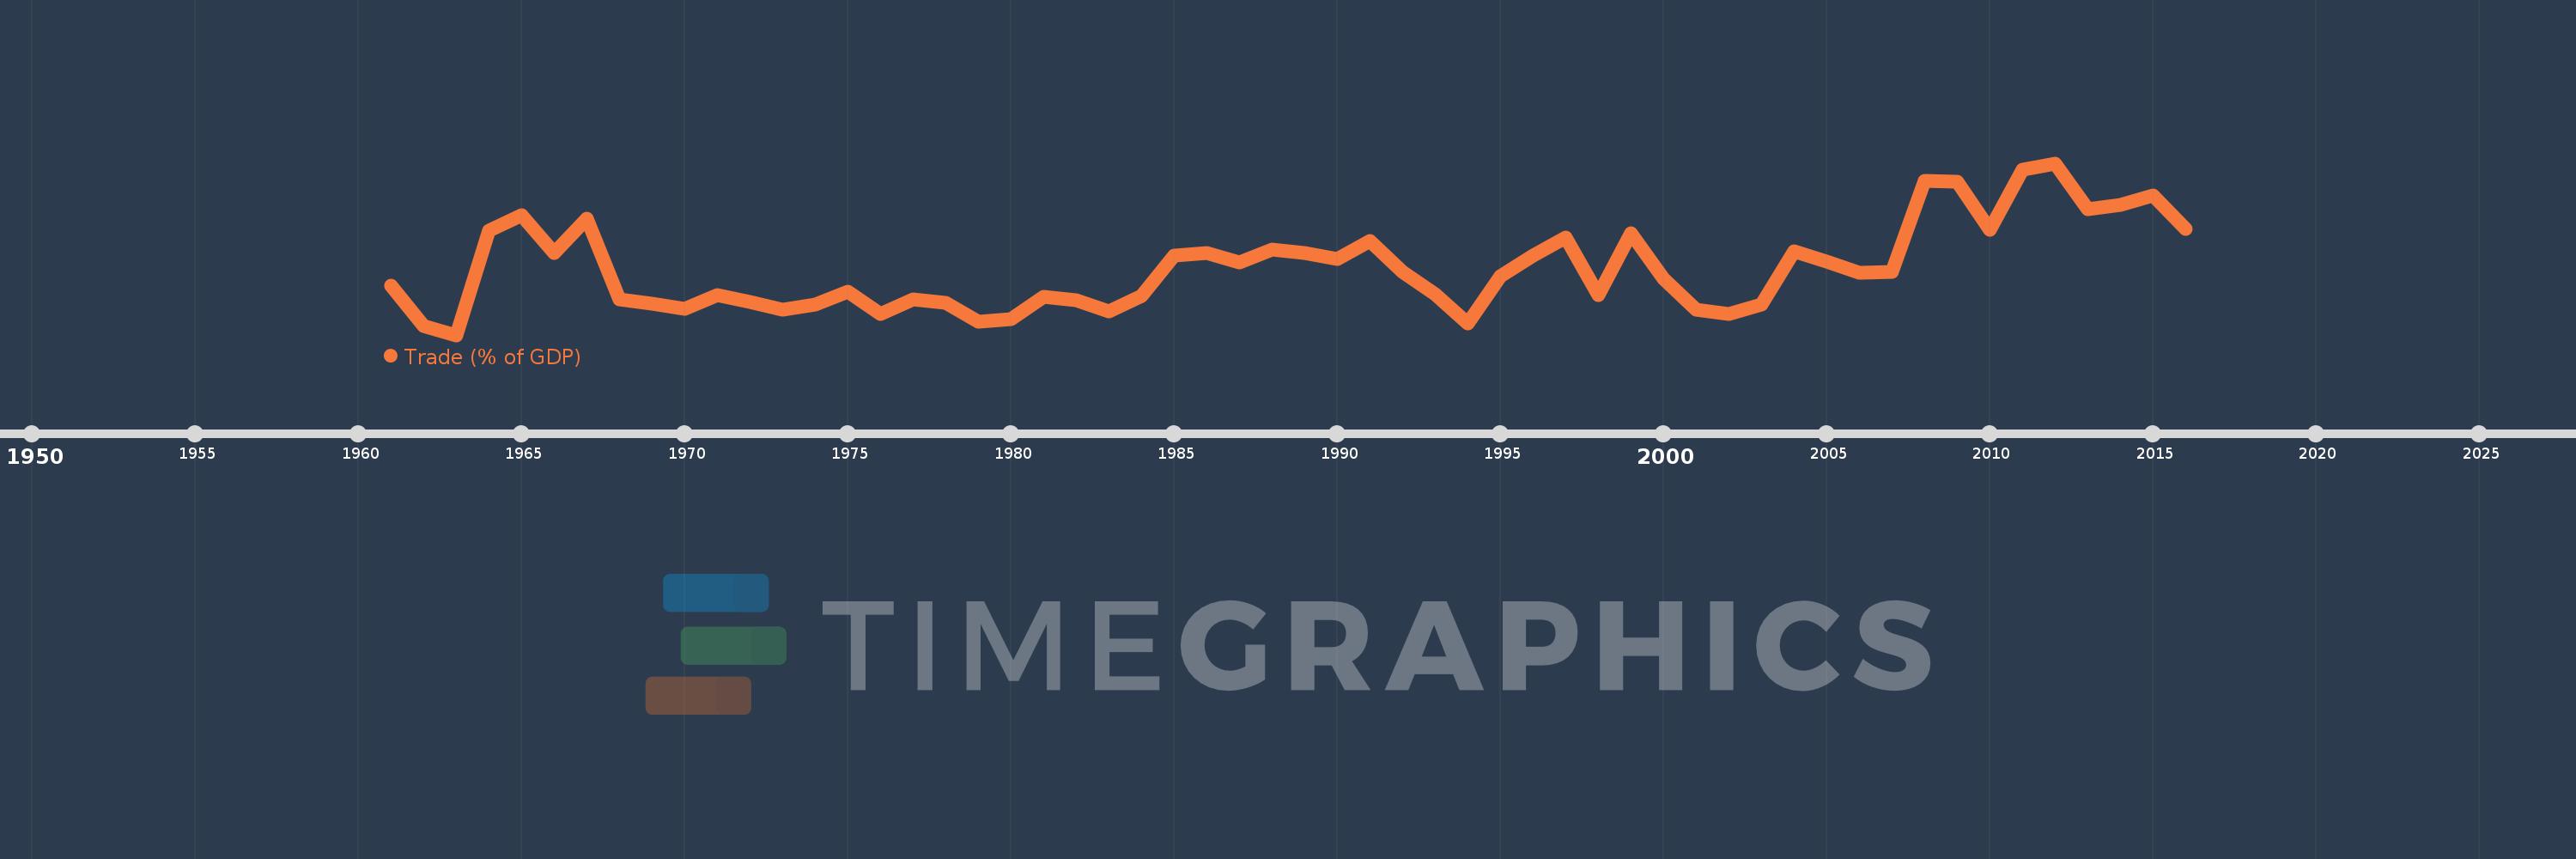
Trade (% of GDP)
2016,2015,2014,2013,2012,2011,2010,2009,2008,2007,2006,2005,2004,2003,2002,2001,2000,1999,1998,1997,1996,1995,1994,1993,1992,1991,1990,1989,1988,1987,1986,1985,1984,1983,1982,1981,1980,1979,1978,1977,1976,1975,1974,1973,1972,1971,1970,1969,1968,1967,1966,1965,1964,1963,1962,1961
Queste statistiche in altri paesi:
AfghanistanAlbaniaAlgeriaAngolaAntigua and BarbudaArab WorldArgentinaArmeniaArubaAustraliaAustriaAzerbaijanBahamas, TheBahrainBangladeshBarbadosBelarusBelgiumBelizeBeninBermudaBhutanBoliviaBosnia and HerzegovinaBotswanaBrazilBrunei DarussalamBulgariaBurkina FasoBurundiCabo VerdeCambodiaCameroonCanadaCaribbean small statesCentral African RepublicCentral Europe and the BalticsChadChileChinaColombiaComorosCongo, Dem. Rep.Congo, Rep.Costa RicaCote d'IvoireCroatiaCubaCyprusCzech RepublicDenmarkDjiboutiDominicaDominican RepublicEarly-demographic dividendEast Asia & PacificEast Asia & Pacific (excluding high income)East Asia & Pacific (IDA & IBRD countries)EcuadorEgypt, Arab Rep.El SalvadorEquatorial GuineaEritreaEstoniaEthiopiaEuro areaEurope & Central AsiaEurope & Central Asia (excluding high income)Europe & Central Asia (IDA & IBRD countries)European UnionFaroe IslandsFijiFinlandFragile and conflict affected situationsFranceFrench PolynesiaGabonGambia, TheGeorgiaGermanyGhanaGreeceGrenadaGuatemalaGuineaGuinea-BissauGuyanaHaitiHeavily indebted poor countries (HIPC)High incomeHondurasHong Kong SAR, ChinaHungaryIBRD onlyIcelandIDA & IBRD totalIDA blendIDA onlyIDA totalIndiaIndonesiaIran, Islamic Rep.IraqIrelandIsraelItalyJamaicaJapanJordanKazakhstanKenyaKiribatiKorea, Rep.KosovoKuwaitKyrgyz RepublicLao PDRLate-demographic dividendLatin America & Caribbean Latin America & Caribbean (excluding high income)Latin America & the Caribbean (IDA & IBRD countries)LatviaLeast developed countries: UN classificationLebanonLesothoLiberiaLibyaLithuaniaLow & middle incomeLow incomeLower middle incomeLuxembourgMacao SAR, ChinaMacedonia, FYRMadagascarMalawiMalaysiaMaldivesMaliMaltaMauritaniaMauritiusMexicoMicronesia, Fed. Sts.Middle East & North AfricaMiddle East & North Africa (excluding high income)Middle East & North Africa (IDA & IBRD countries)Middle incomeMoldovaMongoliaMontenegroMoroccoMozambiqueMyanmarNamibiaNepalNetherlandsNew CaledoniaNew ZealandNicaraguaNigerNigeriaNorth AmericaNorwayOECD membersOmanOther small statesPacific island small statesPakistanPalauPanamaPapua New GuineaParaguayPeruPhilippinesPolandPortugalPost-demographic dividendPre-demographic dividendPuerto RicoQatarRomaniaRussian FederationRwandaSamoaSaudi ArabiaSenegalSerbiaSeychellesSierra LeoneSingaporeSlovak RepublicSloveniaSmall statesSolomon IslandsSomaliaSouth AfricaSouth AsiaSouth Asia (IDA & IBRD)South SudanSpainSri LankaSt. Kitts and NevisSt. LuciaSt. Vincent and the GrenadinesSub-Saharan Africa Sub-Saharan Africa (excluding high income)Sub-Saharan Africa (IDA & IBRD countries)SudanSurinameSwazilandSwedenSwitzerlandSyrian Arab RepublicTajikistanTanzaniaThailandTimor-LesteTogoTongaTrinidad and TobagoTunisiaTurkeyTurkmenistanUgandaUkraineUnited Arab EmiratesUnited KingdomUnited StatesUpper middle incomeUruguayUzbekistanVanuatuVenezuela, RBVietnamWest Bank and GazaWorldYemen, Rep.ZambiaZimbabwe Linea del tempo:
Questa scala temporale mostra un grafico dal 1961 anno al 2016 anno. Congo, Dem. Rep.. I dati fino ad 1960 anno non disponibili. Il numero di osservazioni attuali secondo i date: 56.
La fonte (nome):
Indicatori dello sviluppo mondiale
La fonte (organizzazione):
World Bank national accounts data, and OECD National Accounts data files.
Categorie:
Economy & Growth, Trade
sono stati aggiornati
23 apr 2017 anni
Indicatori delle variazioni dei valori per anni
Minima:
15.191
1 gen 1963 anni
Massimo:
95.003
1 gen 2012 anni
Alla data di osservazione
Valore
Variazione assoluta
La variazione rispetto al valore precedente
1 gen 1961 anni
38.333
+38.333
0.0%
1 gen 1962 anni
19.245
-19.088
-49.79%
1 gen 1963 anni
15.191
-4.054
-21.07%
1 gen 1964 anni
63.479
+48.288
317.88%
1 gen 1965 anni
70.807
+7.328
11.54%
1 gen 1966 anni
53.156
-17.651
-24.93%
1 gen 1967 anni
69.14
+15.984
30.07%
1 gen 1968 anni
31.922
-37.218
-53.83%
1 gen 1969 anni
29.818
-2.105
-6.59%
1 gen 1970 anni
27.411
-2.407
-8.07%
1 gen 1971 anni
33.684
+6.273
22.88%
1 gen 1972 anni
30.675
-3.009
-8.93%
1 gen 1973 anni
27.029
-3.646
-11.89%
1 gen 1974 anni
29.318
+2.289
8.47%
1 gen 1975 anni
35.212
+5.894
20.1%
1 gen 1976 anni
25.054
-10.158
-28.85%
1 gen 1977 anni
31.802
+6.748
26.93%
1 gen 1978 anni
30.001
-1.801
-5.66%
1 gen 1979 anni
21.546
-8.455
-28.18%
1 gen 1980 anni
22.69
+1.144
5.31%
1 gen 1981 anni
32.83
+10.14
44.69%
1 gen 1982 anni
31.283
-1.548
-4.71%
1 gen 1983 anni
26.102
-5.181
-16.56%
1 gen 1984 anni
33.529
+7.427
28.45%
1 gen 1985 anni
52.13
+18.601
55.48%
1 gen 1986 anni
53.145
+1.015
1.95%
1 gen 1987 anni
48.742
-4.403
-8.28%
1 gen 1988 anni
54.843
+6.101
12.52%
1 gen 1989 anni
53.321
-1.522
-2.78%
1 gen 1990 anni
50.328
-2.993
-5.61%
1 gen 1991 anni
58.708
+8.38
16.65%
1 gen 1992 anni
44.505
-14.203
-24.19%
1 gen 1993 anni
34.202
-10.303
-23.15%
1 gen 1994 anni
20.437
-13.765
-40.25%
1 gen 1995 anni
42.517
+22.08
108.04%
1 gen 1996 anni
52.209
+9.692
22.8%
1 gen 1997 anni
60.316
+8.108
15.53%
1 gen 1998 anni
33.75
-26.566
-44.04%
1 gen 1999 anni
62.679
+28.929
85.72%
1 gen 2000 anni
41.178
-21.502
-34.3%
1 gen 2001 anni
27.014
-14.163
-34.4%
1 gen 2002 anni
25.042
-1.972
-7.3%
1 gen 2003 anni
29.317
+4.275
17.07%
1 gen 2004 anni
54.031
+24.715
84.3%
1 gen 2005 anni
49.336
-4.695
-8.69%
1 gen 2006 anni
43.975
-5.362
-10.87%
1 gen 2007 anni
44.665
+0.69
1.57%
1 gen 2008 anni
86.656
+41.991
94.01%
1 gen 2009 anni
86.312
-0.343
-0.4%
1 gen 2010 anni
64.275
-22.037
-25.53%
1 gen 2011 anni
91.936
+27.661
43.04%
1 gen 2012 anni
95.003
+3.067
3.34%
1 gen 2013 anni
73.465
-21.538
-22.67%
1 gen 2014 anni
75.667
+2.202
3.0%
1 gen 2015 anni
80.056
+4.389
5.8%
1 gen 2016 anni
64.464
-15.592
-19.48%
Classificazione dei paesi secondo i statistiche attuali per anni


Commenti: