29
/it/
it
AIzaSyAYiBZKx7MnpbEhh9jyipgxe19OcubqV5w
April 1, 2024
254186
Suriname
SUR
true
2
1
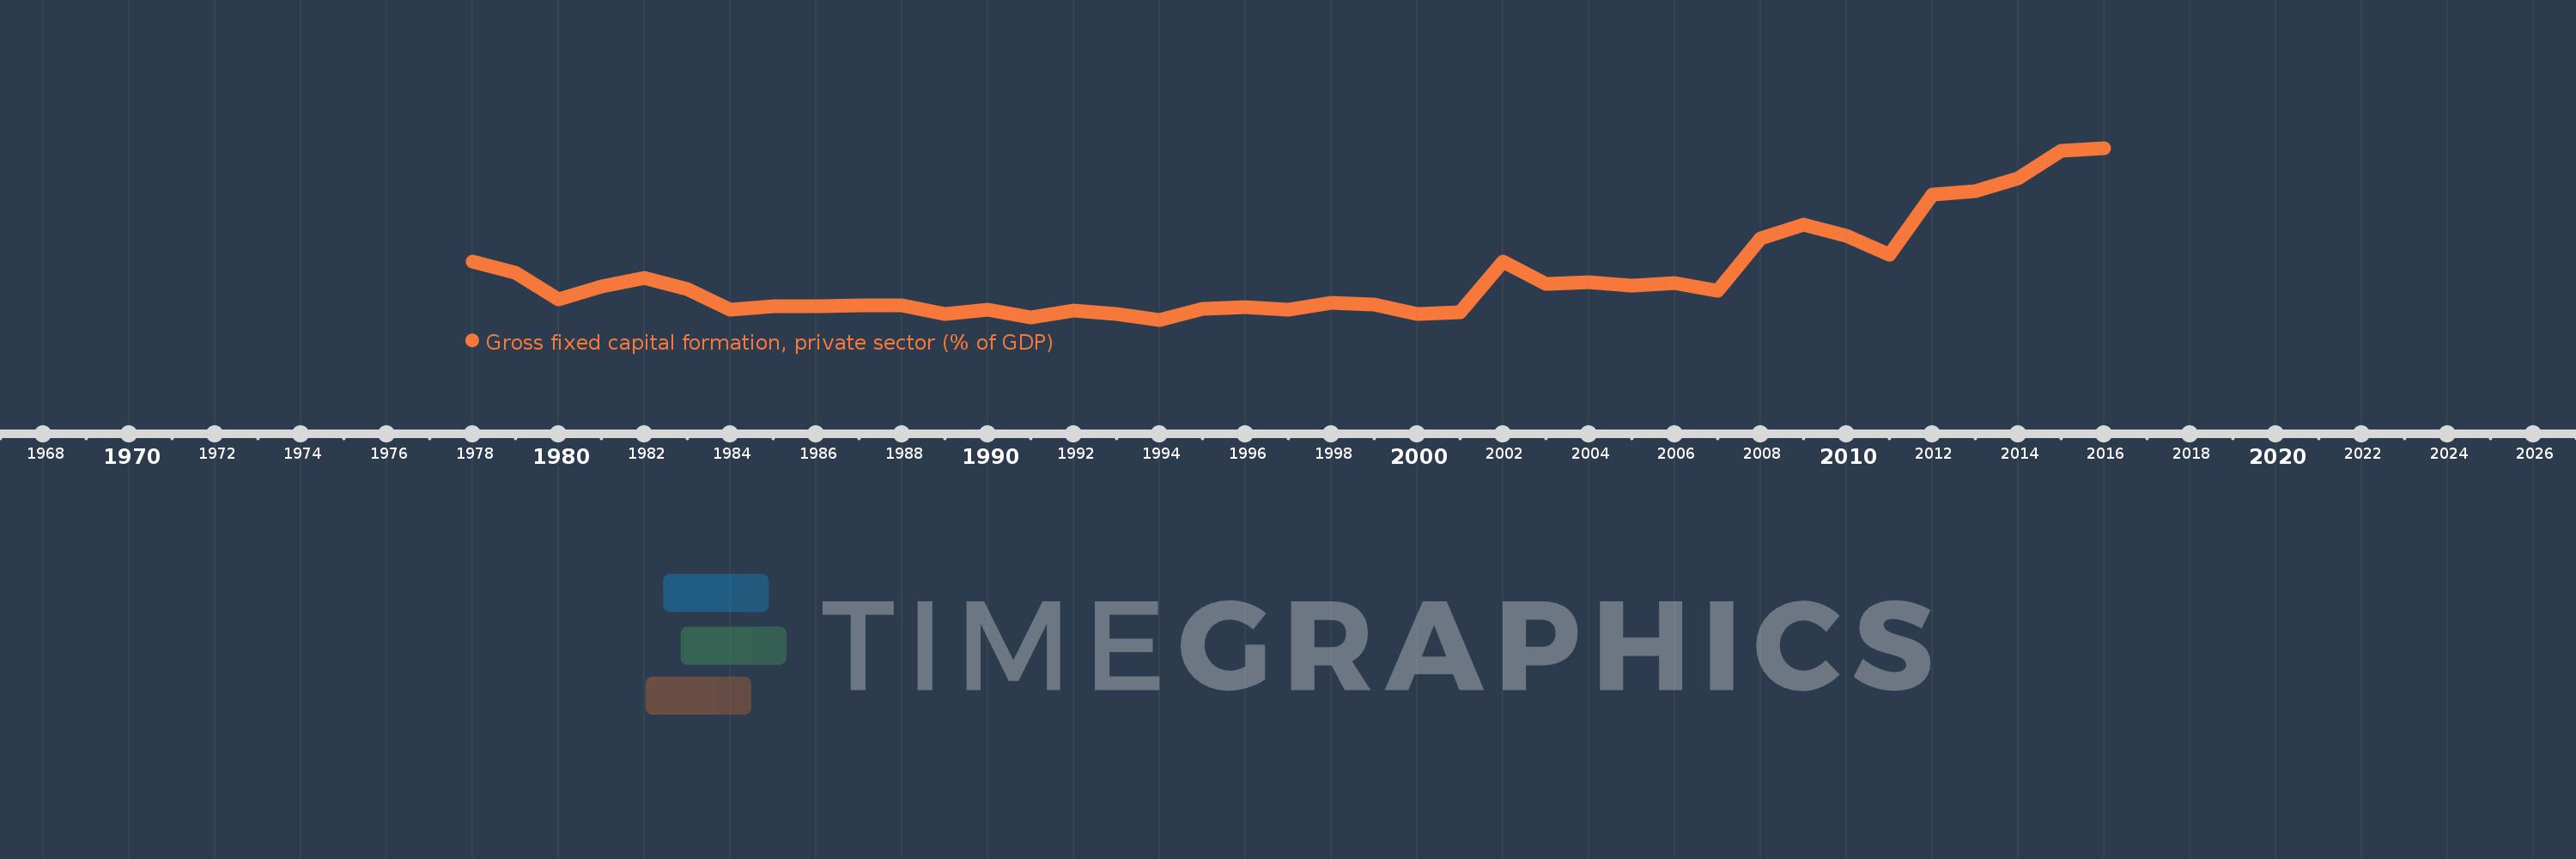
Gross fixed capital formation, private sector (% of GDP)
2016,2015,2014,2013,2012,2011,2010,2009,2008,2007,2006,2005,2004,2003,2002,2001,2000,1999,1998,1997,1996,1995,1994,1993,1992,1991,1990,1989,1988,1987,1986,1985,1984,1983,1982,1981,1980,1979,1978
Queste statistiche in altri paesi:
Linea del tempo:
Questa scala temporale mostra un grafico dal 1978 anno al 2016 anno. Suriname. I dati fino ad 1977 anno non disponibili. Il numero di osservazioni attuali secondo i date: 39.
La fonte (nome):
Indicatori dello sviluppo mondiale
La fonte (organizzazione):
World Bank national accounts data, and OECD National Accounts data files.
Categorie:
Economy & Growth
sono stati aggiornati
23 apr 2017 anni
Indicatori delle variazioni dei valori per anni
Minima:
7.439
1 gen 1994 anni
Massimo:
64.233
1 gen 2016 anni
Alla data di osservazione
Valore
Variazione assoluta
La variazione rispetto al valore precedente
1 gen 1978 anni
26.599
+26.599
0.0%
1 gen 1979 anni
22.978
-3.621
-13.62%
1 gen 1980 anni
14.176
-8.801
-38.3%
1 gen 1981 anni
18.367
+4.191
29.56%
1 gen 1982 anni
21.315
+2.948
16.05%
1 gen 1983 anni
17.593
-3.722
-17.46%
1 gen 1984 anni
10.859
-6.734
-38.28%
1 gen 1985 anni
11.786
+0.927
8.54%
1 gen 1986 anni
11.869
+0.083
0.71%
1 gen 1987 anni
12.127
+0.257
2.17%
1 gen 1988 anni
12.155
+0.028
0.23%
1 gen 1989 anni
9.441
-2.714
-22.33%
1 gen 1990 anni
10.632
+1.191
12.61%
1 gen 1991 anni
8.295
-2.337
-21.98%
1 gen 1992 anni
10.511
+2.216
26.71%
1 gen 1993 anni
9.351
-1.16
-11.04%
1 gen 1994 anni
7.439
-1.912
-20.45%
1 gen 1995 anni
11.026
+3.587
48.23%
1 gen 1996 anni
11.558
+0.531
4.82%
1 gen 1997 anni
10.876
-0.682
-5.9%
1 gen 1998 anni
13.07
+2.194
20.18%
1 gen 1999 anni
12.494
-0.576
-4.4%
1 gen 2000 anni
9.206
-3.289
-26.32%
1 gen 2001 anni
9.789
+0.583
6.33%
1 gen 2002 anni
26.546
+16.757
171.19%
1 gen 2003 anni
19.352
-7.194
-27.1%
1 gen 2004 anni
19.85
+0.498
2.57%
1 gen 2005 anni
18.838
-1.012
-5.1%
1 gen 2006 anni
19.601
+0.763
4.05%
1 gen 2007 anni
17.075
-2.526
-12.89%
1 gen 2008 anni
34.338
+17.263
101.1%
1 gen 2009 anni
38.74
+4.402
12.82%
1 gen 2010 anni
35.166
-3.574
-9.22%
1 gen 2011 anni
29.067
-6.099
-17.34%
1 gen 2012 anni
48.748
+19.681
67.71%
1 gen 2013 anni
49.884
+1.137
2.33%
1 gen 2014 anni
54.093
+4.208
8.44%
1 gen 2015 anni
63.266
+9.173
16.96%
1 gen 2016 anni
64.233
+0.966
1.53%
Classificazione dei paesi secondo i statistiche attuali per anni


Commenti: