29
/it/
it
AIzaSyAYiBZKx7MnpbEhh9jyipgxe19OcubqV5w
April 1, 2024
109735
Congo, Dem. Rep.
COD
true
2
1
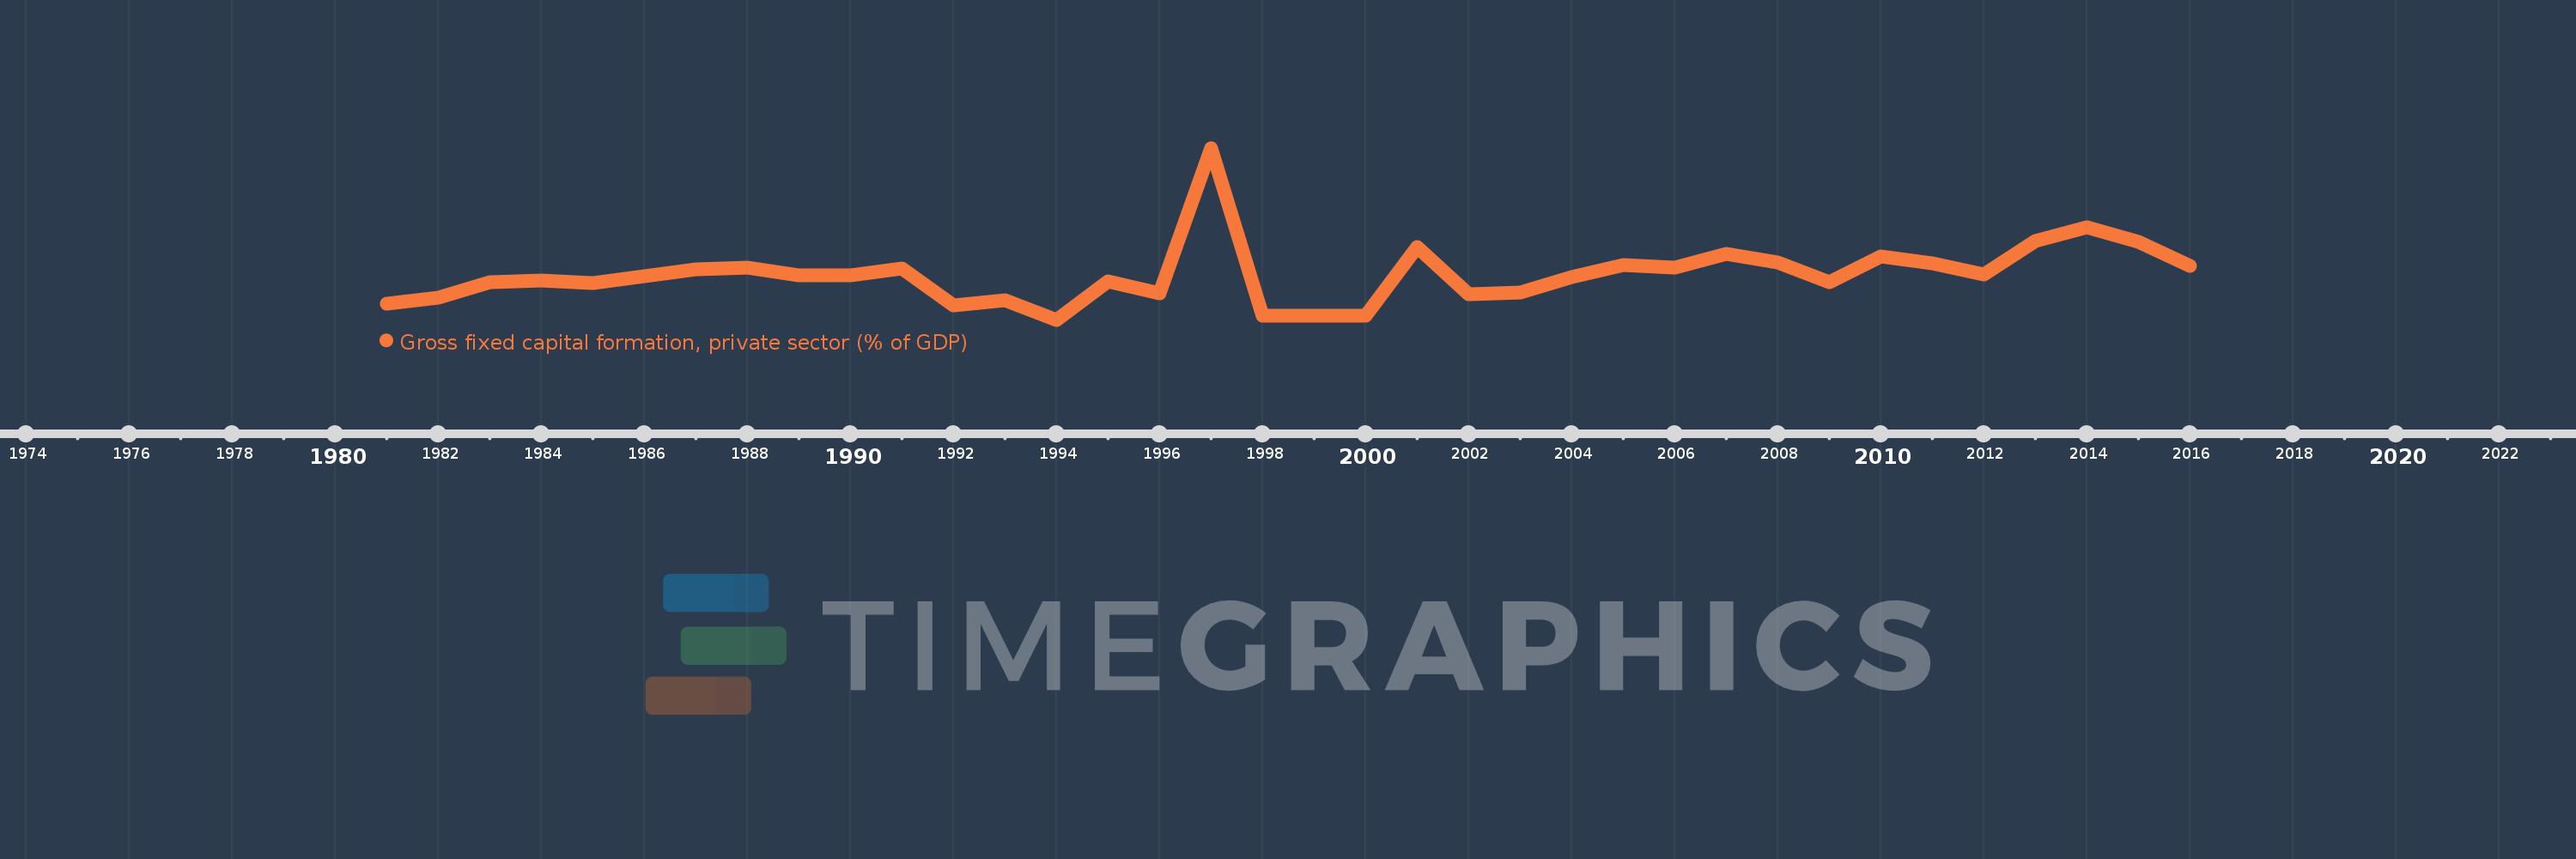
Gross fixed capital formation, private sector (% of GDP)
2016,2015,2014,2013,2012,2011,2010,2009,2008,2007,2006,2005,2004,2003,2002,2001,2000,1999,1998,1997,1996,1995,1994,1993,1992,1991,1990,1989,1988,1987,1986,1985,1984,1983,1982,1981
Queste statistiche in altri paesi:
Linea del tempo:
Questa scala temporale mostra un grafico dal 1981 anno al 2016 anno. Congo, Dem. Rep.. I dati fino ad 1980 anno non disponibili. Il numero di osservazioni attuali secondo i date: 36.
La fonte (nome):
Indicatori dello sviluppo mondiale
La fonte (organizzazione):
World Bank national accounts data, and OECD National Accounts data files.
Categorie:
Economy & Growth
sono stati aggiornati
23 apr 2017 anni
Indicatori delle variazioni dei valori per anni
Minima:
1.378
1 gen 1994 anni
Massimo:
26.595
1 gen 1997 anni
Alla data di osservazione
Valore
Variazione assoluta
La variazione rispetto al valore precedente
1 gen 1981 anni
3.688
+3.688
0.0%
1 gen 1982 anni
4.623
+0.935
25.35%
1 gen 1983 anni
6.914
+2.291
49.57%
1 gen 1984 anni
7.17
+0.256
3.71%
1 gen 1985 anni
6.705
-0.465
-6.48%
1 gen 1986 anni
7.75
+1.044
15.57%
1 gen 1987 anni
8.822
+1.072
13.83%
1 gen 1988 anni
9.028
+0.207
2.34%
1 gen 1989 anni
7.936
-1.092
-12.1%
1 gen 1990 anni
7.938
+0.002
0.02%
1 gen 1991 anni
8.851
+0.913
11.5%
1 gen 1992 anni
3.478
-5.373
-60.7%
1 gen 1993 anni
4.268
+0.79
22.71%
1 gen 1994 anni
1.378
-2.89
-67.71%
1 gen 1995 anni
6.965
+5.586
405.33%
1 gen 1996 anni
5.279
-1.686
-24.21%
1 gen 1997 anni
26.595
+21.316
403.82%
1 gen 1998 anni
2.016
-24.579
-92.42%
1 gen 1999 anni
2.0
-0.016
-0.81%
1 gen 2000 anni
2.0
+0.0
0.01%
1 gen 2001 anni
12.019
+10.019
500.95%
1 gen 2002 anni
5.11
-6.909
-57.48%
1 gen 2003 anni
5.4
+0.29
5.67%
1 gen 2004 anni
7.684
+2.284
42.31%
1 gen 2005 anni
9.408
+1.723
22.42%
1 gen 2006 anni
9.047
-0.361
-3.84%
1 gen 2007 anni
11.02
+1.973
21.81%
1 gen 2008 anni
9.809
-1.211
-10.99%
1 gen 2009 anni
6.865
-2.944
-30.01%
1 gen 2010 anni
10.694
+3.829
55.78%
1 gen 2011 anni
9.635
-1.059
-9.9%
1 gen 2012 anni
8.013
-1.623
-16.84%
1 gen 2013 anni
12.919
+4.906
61.23%
1 gen 2014 anni
14.9
+1.981
15.34%
1 gen 2015 anni
12.874
-2.026
-13.6%
1 gen 2016 anni
9.324
-3.55
-27.58%
Classificazione dei paesi secondo i statistiche attuali per anni


Commenti: