29
/it/
it
AIzaSyAYiBZKx7MnpbEhh9jyipgxe19OcubqV5w
April 1, 2024
132054
Fiji
FJI
true
2
1
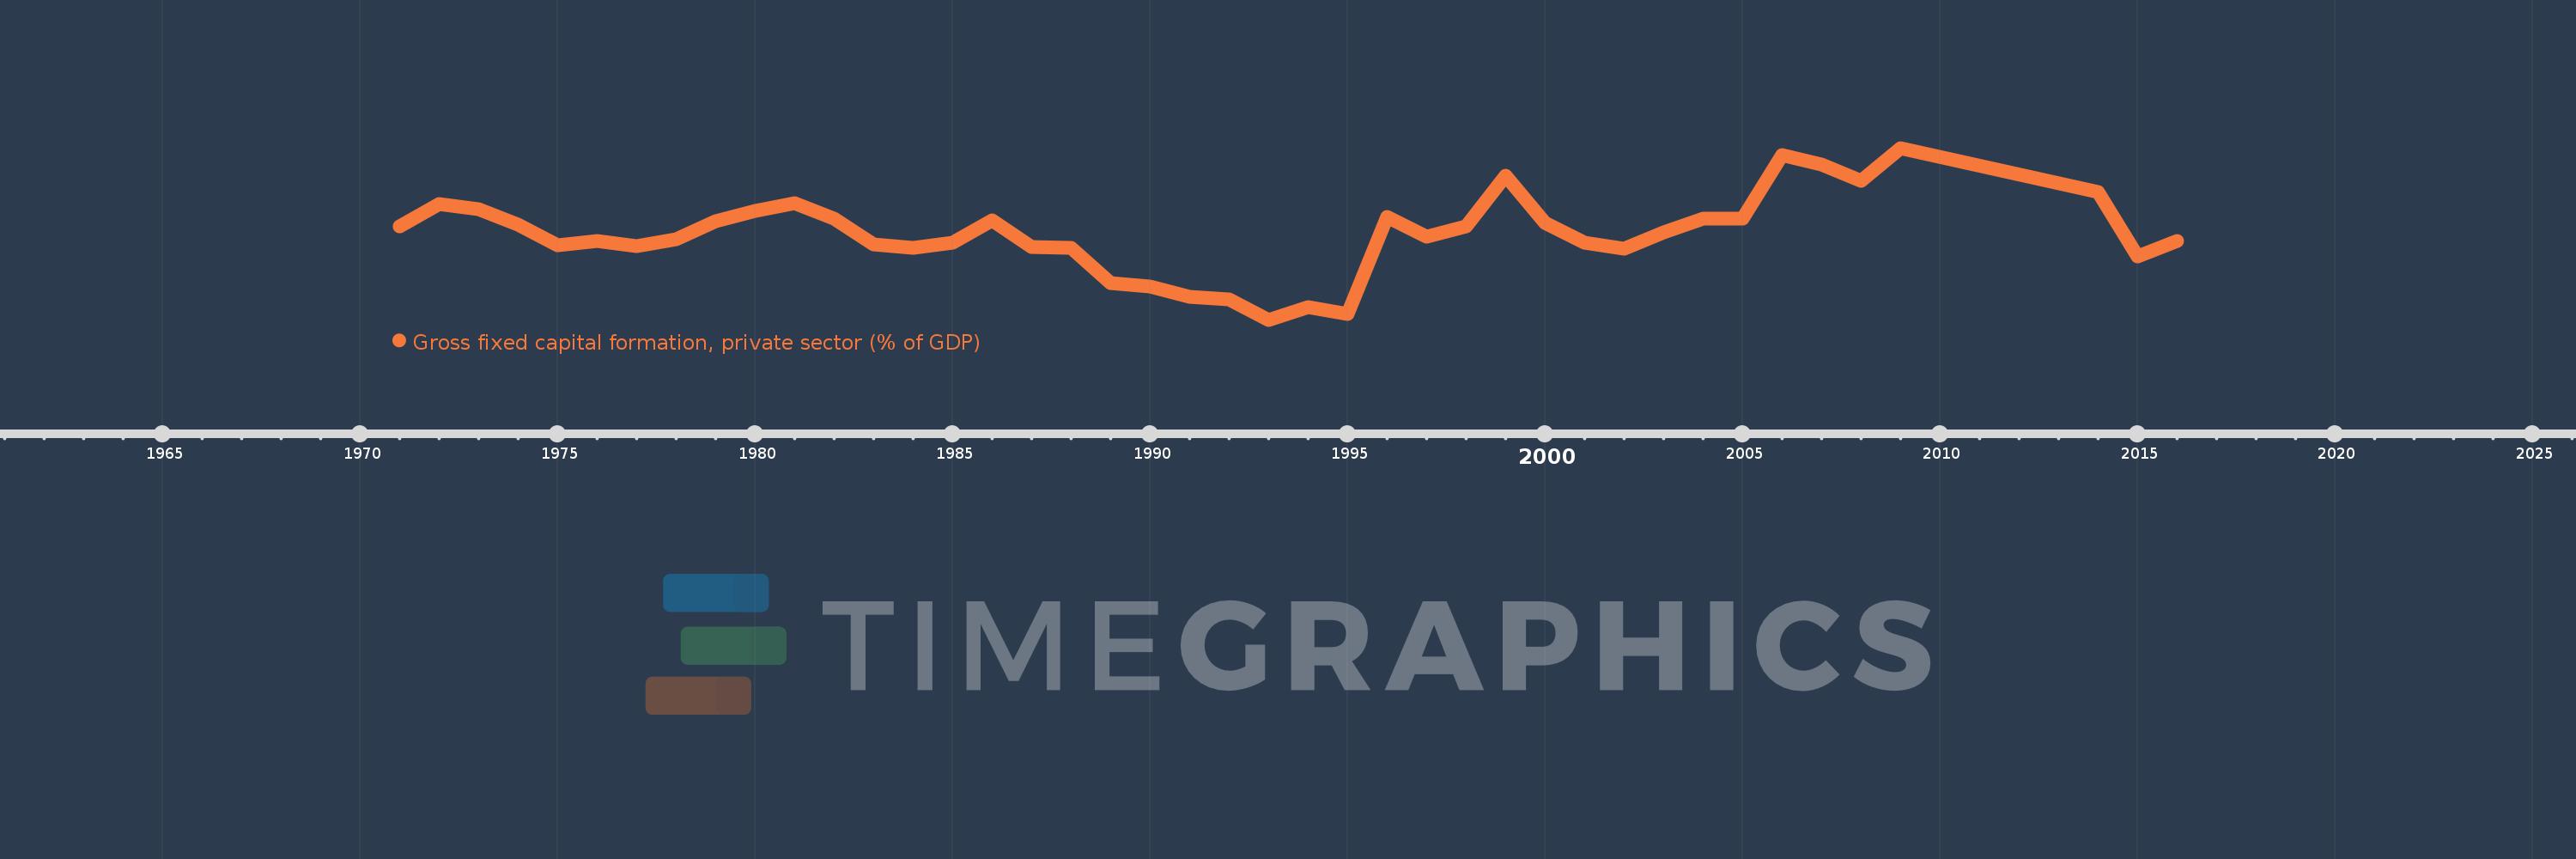
Gross fixed capital formation, private sector (% of GDP)
2016,2015,2014,2009,2008,2007,2006,2005,2004,2003,2002,2001,2000,1999,1998,1997,1996,1995,1994,1993,1992,1991,1990,1989,1988,1987,1986,1985,1984,1983,1982,1981,1980,1979,1978,1977,1976,1975,1974,1973,1972,1971
Queste statistiche in altri paesi:
Linea del tempo:
Questa scala temporale mostra un grafico dal 1971 anno al 2016 anno. Fiji. I dati fino ad 1970 anno non disponibili. Il numero di osservazioni attuali secondo i date: 42.
La fonte (nome):
Indicatori dello sviluppo mondiale
La fonte (organizzazione):
World Bank national accounts data, and OECD National Accounts data files.
Categorie:
Economy & Growth
sono stati aggiornati
23 apr 2017 anni
Indicatori delle variazioni dei valori per anni
Minima:
3.644
1 gen 1993 anni
Massimo:
18.443
1 gen 2009 anni
Alla data di osservazione
Valore
Variazione assoluta
La variazione rispetto al valore precedente
1 gen 1971 anni
11.679
+11.679
0.0%
1 gen 1972 anni
13.591
+1.912
16.38%
1 gen 1973 anni
13.165
-0.426
-3.14%
1 gen 1974 anni
11.853
-1.312
-9.96%
1 gen 1975 anni
10.067
-1.787
-15.07%
1 gen 1976 anni
10.42
+0.353
3.51%
1 gen 1977 anni
10.008
-0.412
-3.95%
1 gen 1978 anni
10.589
+0.581
5.81%
1 gen 1979 anni
12.162
+1.572
14.85%
1 gen 1980 anni
13.013
+0.852
7.0%
1 gen 1981 anni
13.653
+0.639
4.91%
1 gen 1982 anni
12.346
-1.306
-9.57%
1 gen 1983 anni
10.168
-2.178
-17.64%
1 gen 1984 anni
9.823
-0.345
-3.39%
1 gen 1985 anni
10.264
+0.441
4.49%
1 gen 1986 anni
12.184
+1.92
18.7%
1 gen 1987 anni
9.947
-2.236
-18.36%
1 gen 1988 anni
9.869
-0.078
-0.79%
1 gen 1989 anni
6.815
-3.054
-30.94%
1 gen 1990 anni
6.544
-0.271
-3.98%
1 gen 1991 anni
5.586
-0.958
-14.64%
1 gen 1992 anni
5.362
-0.223
-4.0%
1 gen 1993 anni
3.644
-1.718
-32.04%
1 gen 1994 anni
4.731
+1.087
29.83%
1 gen 1995 anni
4.12
-0.611
-12.92%
1 gen 1996 anni
12.498
+8.378
203.35%
1 gen 1997 anni
10.776
-1.721
-13.77%
1 gen 1998 anni
11.69
+0.914
8.48%
1 gen 1999 anni
16.083
+4.393
37.58%
1 gen 2000 anni
11.981
-4.102
-25.51%
1 gen 2001 anni
10.249
-1.732
-14.46%
1 gen 2002 anni
9.748
-0.501
-4.89%
1 gen 2003 anni
11.142
+1.394
14.31%
1 gen 2004 anni
12.352
+1.209
10.86%
1 gen 2005 anni
12.378
+0.027
0.22%
1 gen 2006 anni
17.856
+5.477
44.25%
1 gen 2007 anni
17.033
-0.822
-4.61%
1 gen 2008 anni
15.618
-1.415
-8.31%
1 gen 2009 anni
18.443
+2.825
18.09%
1 gen 2014 anni
14.645
-3.798
-20.59%
1 gen 2015 anni
9.08
-5.565
-38.0%
1 gen 2016 anni
10.444
+1.364
15.02%
Classificazione dei paesi secondo i statistiche attuali per anni


Commenti: