29
/it/
it
AIzaSyAYiBZKx7MnpbEhh9jyipgxe19OcubqV5w
April 1, 2024
253461
Sudan
SDN
true
2
1
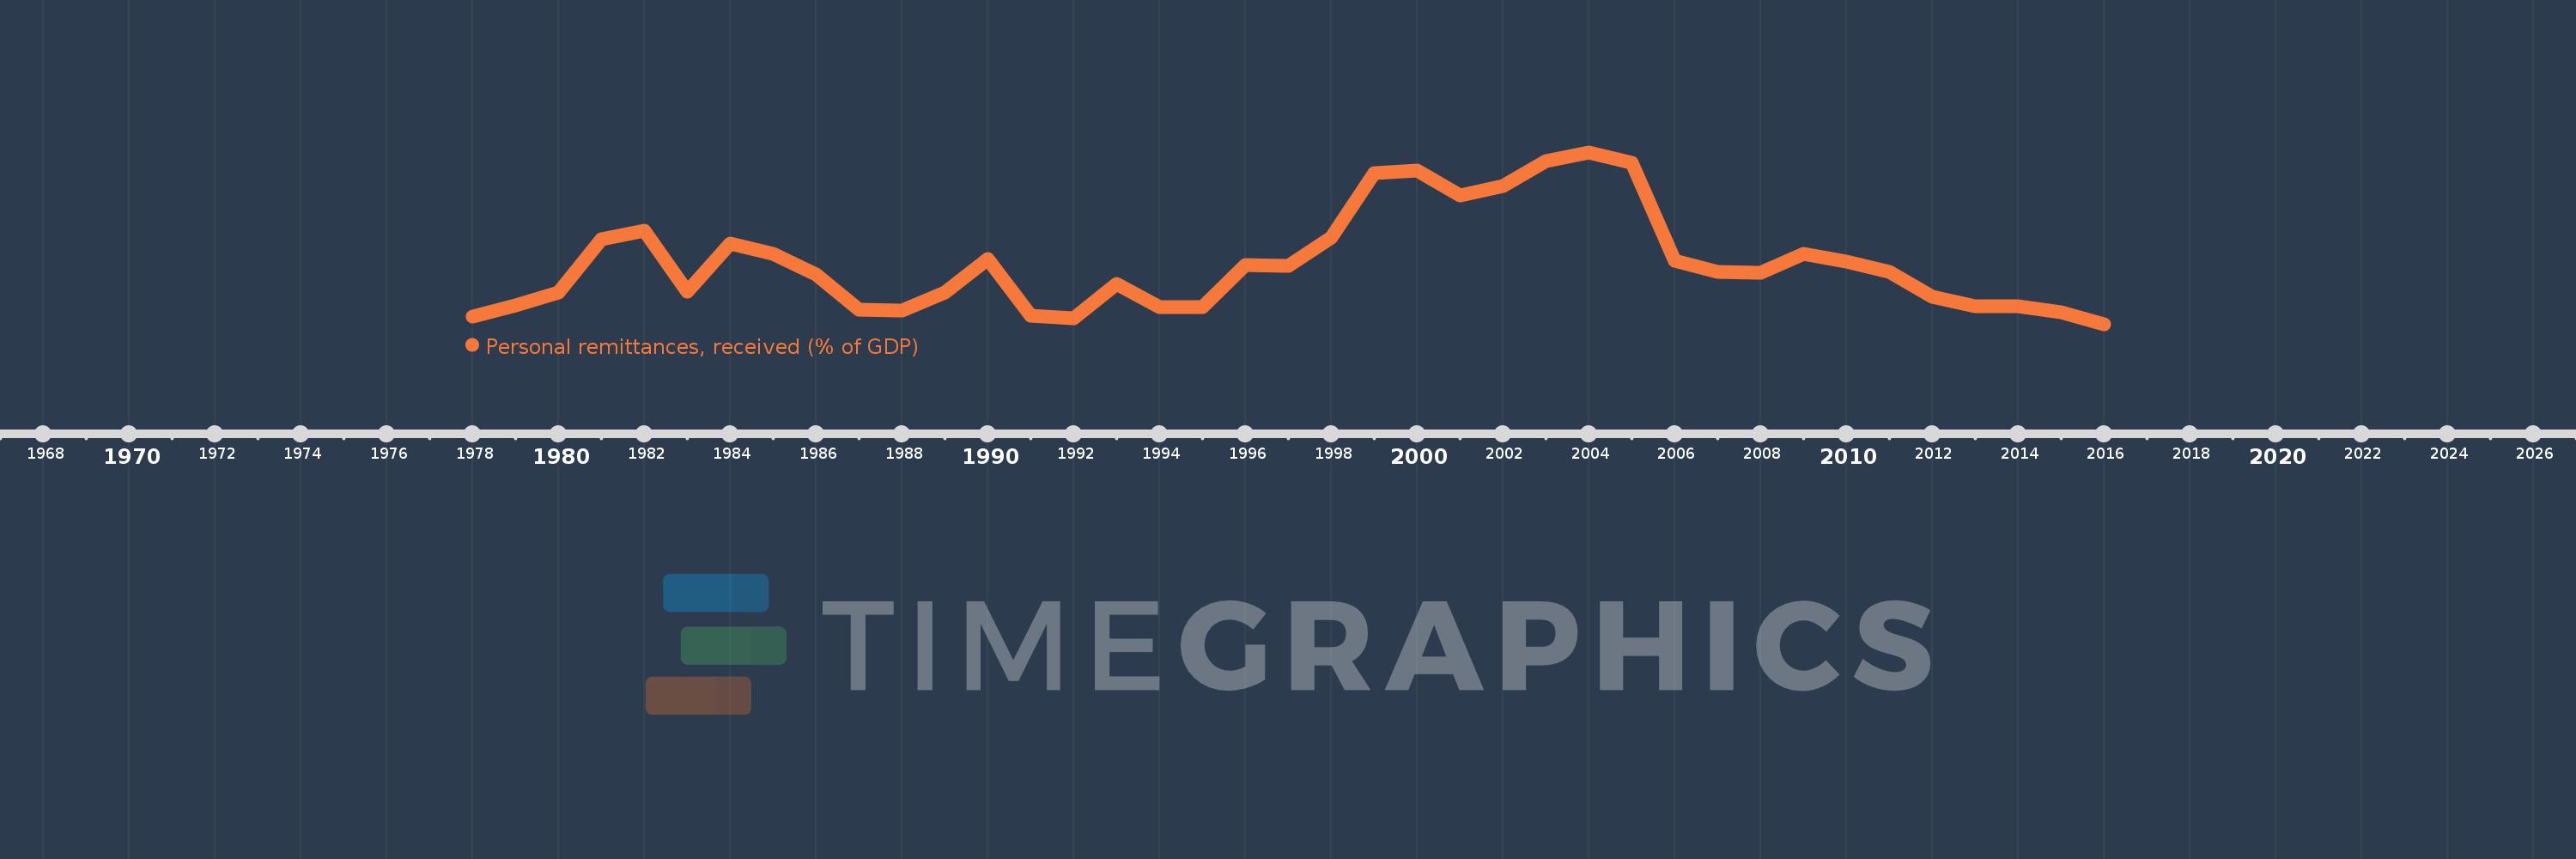
Personal remittances, received (% of GDP)
2016,2015,2014,2013,2012,2011,2010,2009,2008,2007,2006,2005,2004,2003,2002,2001,2000,1999,1998,1997,1996,1995,1994,1993,1992,1991,1990,1989,1988,1987,1986,1985,1984,1983,1982,1981,1980,1979,1978
Queste statistiche in altri paesi:
AfghanistanAlbaniaAlgeriaAngolaAntigua and BarbudaArab WorldArgentinaArmeniaArubaAustraliaAustriaAzerbaijanBangladeshBarbadosBelarusBelgiumBelizeBeninBermudaBhutanBoliviaBosnia and HerzegovinaBotswanaBrazilBulgariaBurkina FasoBurundiCabo VerdeCambodiaCameroonCanadaCaribbean small statesCentral African RepublicCentral Europe and the BalticsChadChileChinaColombiaComorosCongo, Dem. Rep.Congo, Rep.Costa RicaCote d'IvoireCroatiaCyprusCzech RepublicDenmarkDjiboutiDominicaDominican RepublicEarly-demographic dividendEast Asia & PacificEast Asia & Pacific (excluding high income)East Asia & Pacific (IDA & IBRD countries)EcuadorEgypt, Arab Rep.El SalvadorEquatorial GuineaEritreaEstoniaEthiopiaEuro areaEurope & Central AsiaEurope & Central Asia (excluding high income)Europe & Central Asia (IDA & IBRD countries)European UnionFaroe IslandsFijiFinlandFragile and conflict affected situationsFranceGabonGambia, TheGeorgiaGermanyGhanaGreeceGrenadaGuatemalaGuineaGuinea-BissauGuyanaHaitiHeavily indebted poor countries (HIPC)High incomeHondurasHong Kong SAR, ChinaHungaryIBRD onlyIcelandIDA & IBRD totalIDA blendIDA onlyIDA totalIndiaIndonesiaIran, Islamic Rep.IraqIrelandIsraelItalyJamaicaJapanJordanKazakhstanKenyaKiribatiKorea, Rep.KosovoKuwaitKyrgyz RepublicLao PDRLate-demographic dividendLatin America & Caribbean Latin America & Caribbean (excluding high income)Latin America & the Caribbean (IDA & IBRD countries)LatviaLeast developed countries: UN classificationLebanonLesothoLiberiaLibyaLithuaniaLow & middle incomeLow incomeLower middle incomeLuxembourgMacao SAR, ChinaMacedonia, FYRMadagascarMalawiMalaysiaMaldivesMaliMaltaMarshall IslandsMauritaniaMauritiusMexicoMicronesia, Fed. Sts.Middle East & North AfricaMiddle East & North Africa (excluding high income)Middle East & North Africa (IDA & IBRD countries)Middle incomeMoldovaMongoliaMontenegroMoroccoMozambiqueMyanmarNamibiaNepalNetherlandsNew ZealandNicaraguaNigerNigeriaNorth AmericaNorwayOECD membersOmanOther small statesPacific island small statesPakistanPalauPanamaPapua New GuineaParaguayPeruPhilippinesPolandPortugalPost-demographic dividendPre-demographic dividendQatarRomaniaRussian FederationRwandaSamoaSao Tome and PrincipeSaudi ArabiaSenegalSerbiaSeychellesSierra LeoneSlovak RepublicSloveniaSmall statesSolomon IslandsSouth AfricaSouth AsiaSouth Asia (IDA & IBRD)South SudanSpainSri LankaSt. Kitts and NevisSt. LuciaSt. Vincent and the GrenadinesSub-Saharan Africa Sub-Saharan Africa (excluding high income)Sub-Saharan Africa (IDA & IBRD countries)SudanSurinameSwazilandSwedenSwitzerlandSyrian Arab RepublicTajikistanTanzaniaThailandTimor-LesteTogoTongaTrinidad and TobagoTunisiaTurkeyTurkmenistanTuvaluUgandaUkraineUnited KingdomUnited StatesUpper middle incomeUruguayUzbekistanVanuatuVenezuela, RBVietnamWest Bank and GazaWorldYemen, Rep.ZambiaZimbabwe Linea del tempo:
Questa scala temporale mostra un grafico dal 1978 anno al 2016 anno. Sudan. I dati fino ad 1977 anno non disponibili. Il numero di osservazioni attuali secondo i date: 39.
La fonte (nome):
Indicatori dello sviluppo mondiale
La fonte (organizzazione):
World Bank staff estimates based on IMF balance of payments data, and World Bank and OECD GDP estimates.
Categorie:
Economy & Growth, Financial Sector
sono stati aggiornati
23 apr 2017 anni
Indicatori delle variazioni dei valori per anni
Minima:
0.156
1 gen 2016 anni
Massimo:
6.934
1 gen 2004 anni
Alla data di osservazione
Valore
Variazione assoluta
La variazione rispetto al valore precedente
1 gen 1978 anni
0.465
+0.465
0.0%
1 gen 1979 anni
0.899
+0.434
93.3%
1 gen 1980 anni
1.416
+0.517
57.45%
1 gen 1981 anni
3.515
+2.099
148.23%
1 gen 1982 anni
3.834
+0.319
9.07%
1 gen 1983 anni
1.441
-2.393
-62.42%
1 gen 1984 anni
3.335
+1.894
131.49%
1 gen 1985 anni
2.935
-0.399
-11.98%
1 gen 1986 anni
2.103
-0.833
-28.37%
1 gen 1987 anni
0.719
-1.384
-65.82%
1 gen 1988 anni
0.684
-0.035
-4.85%
1 gen 1989 anni
1.411
+0.728
106.43%
1 gen 1990 anni
2.725
+1.314
93.08%
1 gen 1991 anni
0.499
-2.226
-81.7%
1 gen 1992 anni
0.399
-0.1
-20.02%
1 gen 1993 anni
1.759
+1.36
340.77%
1 gen 1994 anni
0.847
-0.912
-51.85%
1 gen 1995 anni
0.838
-0.009
-1.04%
1 gen 1996 anni
2.503
+1.665
198.77%
1 gen 1997 anni
2.456
-0.047
-1.88%
1 gen 1998 anni
3.592
+1.136
46.23%
1 gen 1999 anni
6.103
+2.511
69.9%
1 gen 2000 anni
6.226
+0.123
2.02%
1 gen 2001 anni
5.228
-0.998
-16.04%
1 gen 2002 anni
5.61
+0.382
7.31%
1 gen 2003 anni
6.605
+0.994
17.72%
1 gen 2004 anni
6.934
+0.329
4.99%
1 gen 2005 anni
6.538
-0.396
-5.71%
1 gen 2006 anni
2.653
-3.885
-59.42%
1 gen 2007 anni
2.236
-0.418
-15.75%
1 gen 2008 anni
2.178
-0.057
-2.57%
1 gen 2009 anni
2.917
+0.739
33.93%
1 gen 2010 anni
2.623
-0.294
-10.07%
1 gen 2011 anni
2.218
-0.406
-15.47%
1 gen 2012 anni
1.224
-0.993
-44.8%
1 gen 2013 anni
0.875
-0.35
-28.56%
1 gen 2014 anni
0.86
-0.015
-1.71%
1 gen 2015 anni
0.617
-0.243
-28.27%
1 gen 2016 anni
0.156
-0.461
-74.73%
Classificazione dei paesi secondo i statistiche attuali per anni


Commenti: