29
/it/
it
AIzaSyAYiBZKx7MnpbEhh9jyipgxe19OcubqV5w
April 1, 2024
246084
South Africa
ZAF
true
2
1
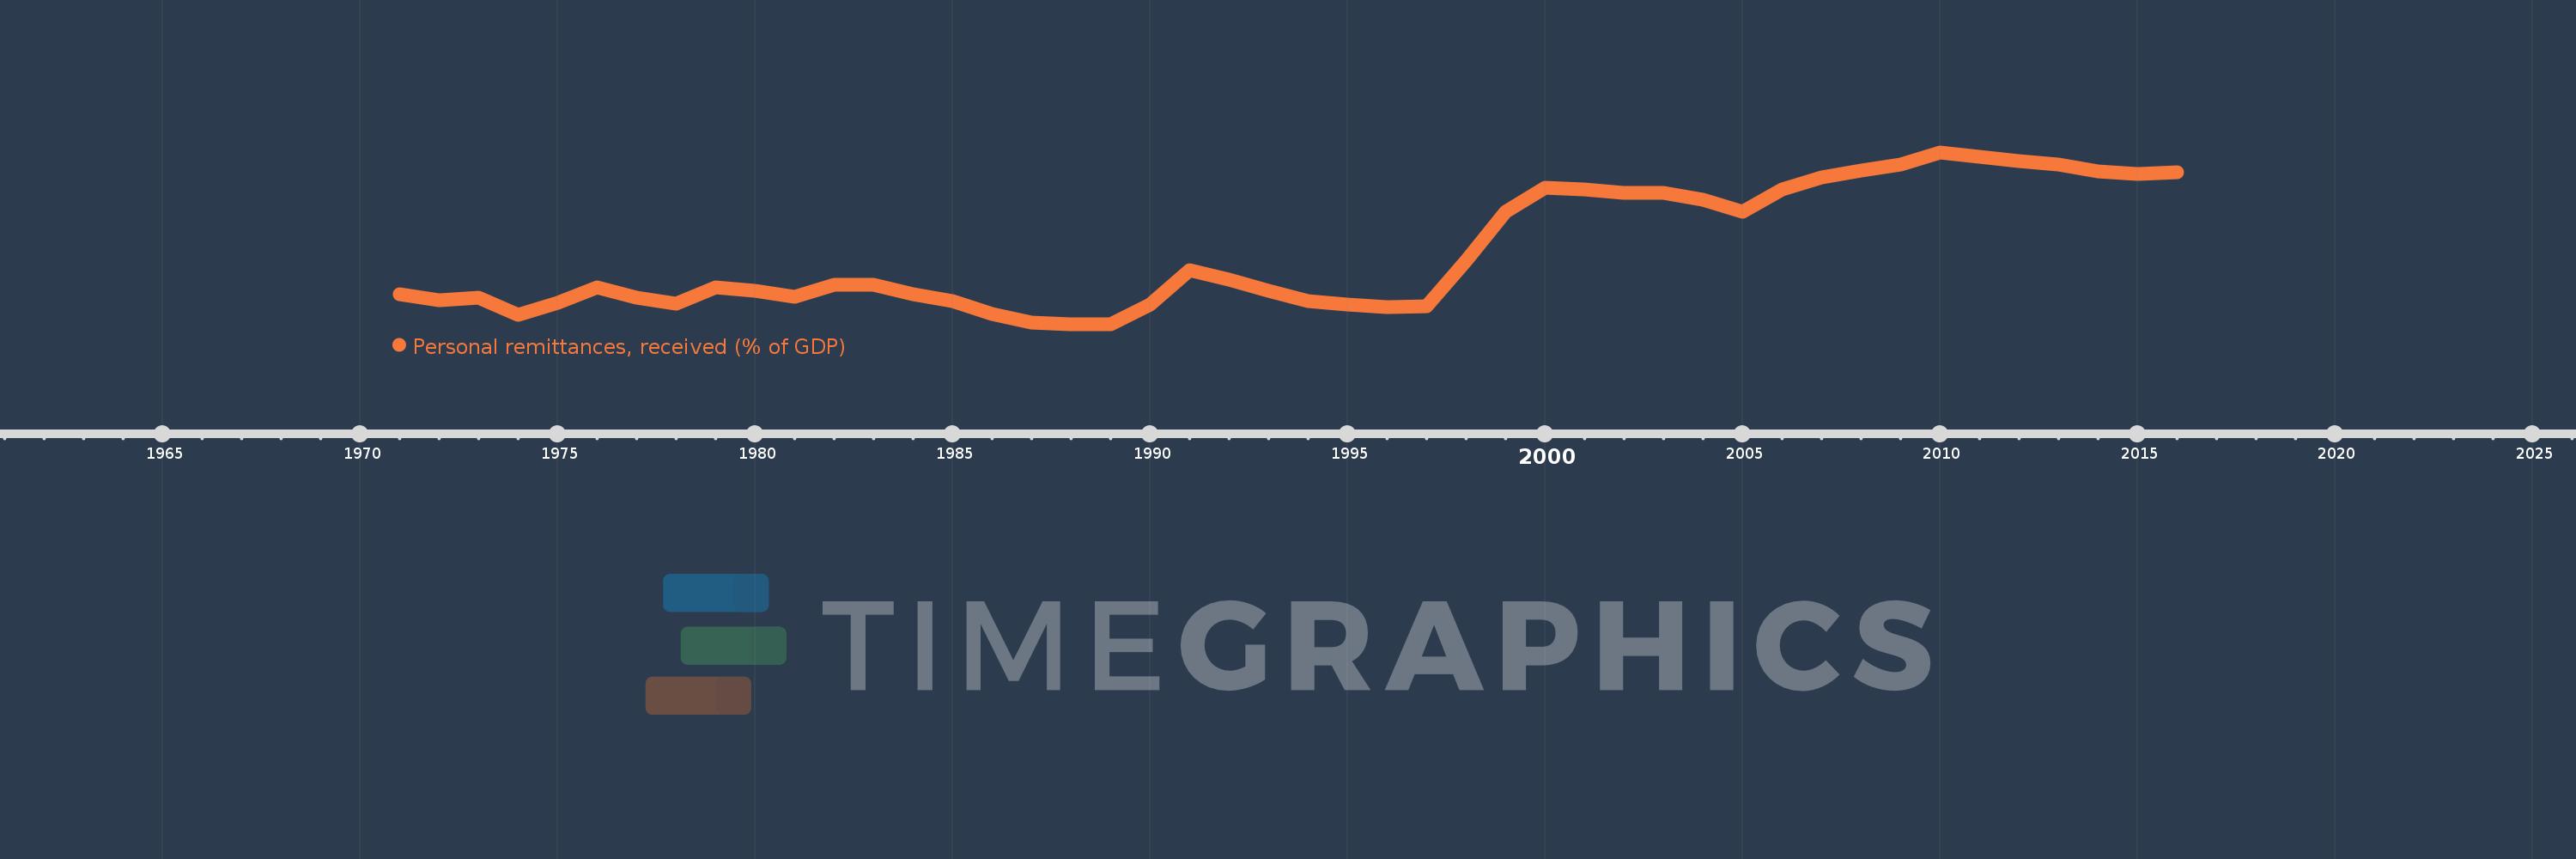
Personal remittances, received (% of GDP)
2016,2015,2014,2013,2012,2011,2010,2009,2008,2007,2006,2005,2004,2003,2002,2001,2000,1999,1998,1997,1996,1995,1994,1993,1992,1991,1990,1989,1988,1987,1986,1985,1984,1983,1982,1981,1980,1979,1978,1977,1976,1975,1974,1973,1972,1971
Queste statistiche in altri paesi:
AfghanistanAlbaniaAlgeriaAngolaAntigua and BarbudaArab WorldArgentinaArmeniaArubaAustraliaAustriaAzerbaijanBangladeshBarbadosBelarusBelgiumBelizeBeninBermudaBhutanBoliviaBosnia and HerzegovinaBotswanaBrazilBulgariaBurkina FasoBurundiCabo VerdeCambodiaCameroonCanadaCaribbean small statesCentral African RepublicCentral Europe and the BalticsChadChileChinaColombiaComorosCongo, Dem. Rep.Congo, Rep.Costa RicaCote d'IvoireCroatiaCyprusCzech RepublicDenmarkDjiboutiDominicaDominican RepublicEarly-demographic dividendEast Asia & PacificEast Asia & Pacific (excluding high income)East Asia & Pacific (IDA & IBRD countries)EcuadorEgypt, Arab Rep.El SalvadorEquatorial GuineaEritreaEstoniaEthiopiaEuro areaEurope & Central AsiaEurope & Central Asia (excluding high income)Europe & Central Asia (IDA & IBRD countries)European UnionFaroe IslandsFijiFinlandFragile and conflict affected situationsFranceGabonGambia, TheGeorgiaGermanyGhanaGreeceGrenadaGuatemalaGuineaGuinea-BissauGuyanaHaitiHeavily indebted poor countries (HIPC)High incomeHondurasHong Kong SAR, ChinaHungaryIBRD onlyIcelandIDA & IBRD totalIDA blendIDA onlyIDA totalIndiaIndonesiaIran, Islamic Rep.IraqIrelandIsraelItalyJamaicaJapanJordanKazakhstanKenyaKiribatiKorea, Rep.KosovoKuwaitKyrgyz RepublicLao PDRLate-demographic dividendLatin America & Caribbean Latin America & Caribbean (excluding high income)Latin America & the Caribbean (IDA & IBRD countries)LatviaLeast developed countries: UN classificationLebanonLesothoLiberiaLibyaLithuaniaLow & middle incomeLow incomeLower middle incomeLuxembourgMacao SAR, ChinaMacedonia, FYRMadagascarMalawiMalaysiaMaldivesMaliMaltaMarshall IslandsMauritaniaMauritiusMexicoMicronesia, Fed. Sts.Middle East & North AfricaMiddle East & North Africa (excluding high income)Middle East & North Africa (IDA & IBRD countries)Middle incomeMoldovaMongoliaMontenegroMoroccoMozambiqueMyanmarNamibiaNepalNetherlandsNew ZealandNicaraguaNigerNigeriaNorth AmericaNorwayOECD membersOmanOther small statesPacific island small statesPakistanPalauPanamaPapua New GuineaParaguayPeruPhilippinesPolandPortugalPost-demographic dividendPre-demographic dividendQatarRomaniaRussian FederationRwandaSamoaSao Tome and PrincipeSaudi ArabiaSenegalSerbiaSeychellesSierra LeoneSlovak RepublicSloveniaSmall statesSolomon IslandsSouth AfricaSouth AsiaSouth Asia (IDA & IBRD)South SudanSpainSri LankaSt. Kitts and NevisSt. LuciaSt. Vincent and the GrenadinesSub-Saharan Africa Sub-Saharan Africa (excluding high income)Sub-Saharan Africa (IDA & IBRD countries)SudanSurinameSwazilandSwedenSwitzerlandSyrian Arab RepublicTajikistanTanzaniaThailandTimor-LesteTogoTongaTrinidad and TobagoTunisiaTurkeyTurkmenistanTuvaluUgandaUkraineUnited KingdomUnited StatesUpper middle incomeUruguayUzbekistanVanuatuVenezuela, RBVietnamWest Bank and GazaWorldYemen, Rep.ZambiaZimbabwe Linea del tempo:
Questa scala temporale mostra un grafico dal 1971 anno al 2016 anno. South Africa. I dati fino ad 1970 anno non disponibili. Il numero di osservazioni attuali secondo i date: 46.
La fonte (nome):
Indicatori dello sviluppo mondiale
La fonte (organizzazione):
World Bank staff estimates based on IMF balance of payments data, and World Bank and OECD GDP estimates.
Categorie:
Economy & Growth, Financial Sector
sono stati aggiornati
23 apr 2017 anni
Indicatori delle variazioni dei valori per anni
Minima:
0.043
1 gen 1989 anni
Massimo:
0.291
1 gen 2010 anni
Alla data di osservazione
Valore
Variazione assoluta
La variazione rispetto al valore precedente
1 gen 1971 anni
0.086
+0.086
0.0%
1 gen 1972 anni
0.078
-0.008
-9.53%
1 gen 1973 anni
0.081
+0.003
4.49%
1 gen 1974 anni
0.056
-0.025
-31.34%
1 gen 1975 anni
0.074
+0.018
32.41%
1 gen 1976 anni
0.096
+0.023
30.45%
1 gen 1977 anni
0.081
-0.015
-15.94%
1 gen 1978 anni
0.073
-0.008
-9.96%
1 gen 1979 anni
0.096
+0.023
32.12%
1 gen 1980 anni
0.091
-0.005
-5.21%
1 gen 1981 anni
0.083
-0.008
-8.85%
1 gen 1982 anni
0.1
+0.017
20.08%
1 gen 1983 anni
0.1
+0.0
0.43%
1 gen 1984 anni
0.086
-0.015
-14.84%
1 gen 1985 anni
0.076
-0.009
-11.07%
1 gen 1986 anni
0.058
-0.018
-24.14%
1 gen 1987 anni
0.045
-0.013
-22.61%
1 gen 1988 anni
0.043
-0.001
-2.65%
1 gen 1989 anni
0.043
0.0
-0.3%
1 gen 1990 anni
0.071
+0.028
63.52%
1 gen 1991 anni
0.121
+0.05
70.76%
1 gen 1992 anni
0.107
-0.014
-11.28%
1 gen 1993 anni
0.091
-0.016
-14.9%
1 gen 1994 anni
0.076
-0.016
-17.15%
1 gen 1995 anni
0.071
-0.005
-6.67%
1 gen 1996 anni
0.068
-0.003
-4.13%
1 gen 1997 anni
0.069
+0.001
1.94%
1 gen 1998 anni
0.135
+0.066
95.38%
1 gen 1999 anni
0.205
+0.07
52.22%
1 gen 2000 anni
0.24
+0.034
16.63%
1 gen 2001 anni
0.238
-0.001
-0.62%
1 gen 2002 anni
0.232
-0.006
-2.66%
1 gen 2003 anni
0.232
+0.0
0.2%
1 gen 2004 anni
0.223
-0.009
-3.97%
1 gen 2005 anni
0.205
-0.018
-8.16%
1 gen 2006 anni
0.238
+0.033
16.24%
1 gen 2007 anni
0.255
+0.017
7.01%
1 gen 2008 anni
0.265
+0.01
3.89%
1 gen 2009 anni
0.273
+0.009
3.27%
1 gen 2010 anni
0.291
+0.018
6.59%
1 gen 2011 anni
0.285
-0.006
-2.18%
1 gen 2012 anni
0.278
-0.007
-2.37%
1 gen 2013 anni
0.274
-0.005
-1.64%
1 gen 2014 anni
0.264
-0.01
-3.5%
1 gen 2015 anni
0.26
-0.004
-1.54%
1 gen 2016 anni
0.262
+0.002
0.9%
Classificazione dei paesi secondo i statistiche attuali per anni


Commenti: