29
/it/
it
AIzaSyAYiBZKx7MnpbEhh9jyipgxe19OcubqV5w
April 1, 2024
105322
Chile
CHL
true
2
1
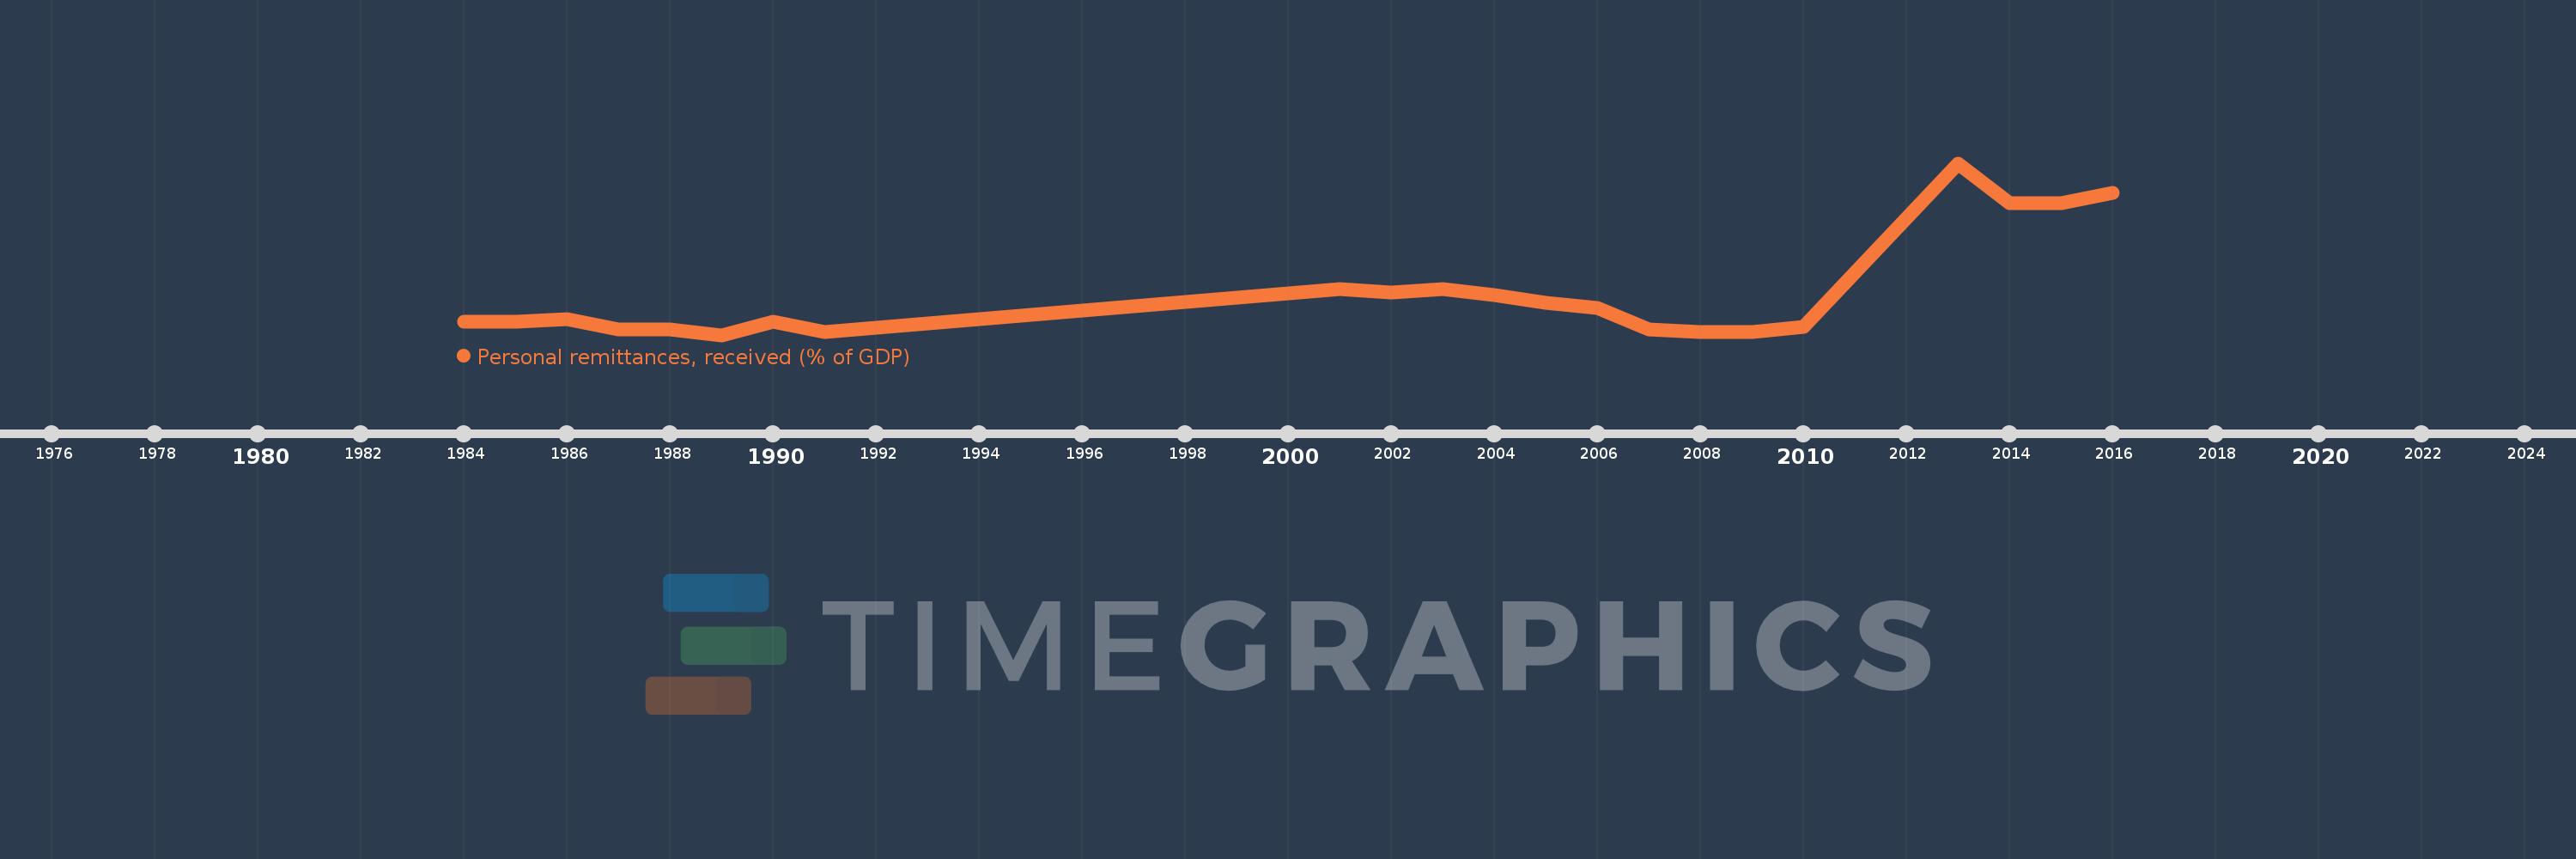
Personal remittances, received (% of GDP)
2016,2015,2014,2013,2010,2009,2008,2007,2006,2005,2004,2003,2002,2001,1991,1990,1989,1988,1987,1986,1985,1984
Queste statistiche in altri paesi:
AfghanistanAlbaniaAlgeriaAngolaAntigua and BarbudaArab WorldArgentinaArmeniaArubaAustraliaAustriaAzerbaijanBangladeshBarbadosBelarusBelgiumBelizeBeninBermudaBhutanBoliviaBosnia and HerzegovinaBotswanaBrazilBulgariaBurkina FasoBurundiCabo VerdeCambodiaCameroonCanadaCaribbean small statesCentral African RepublicCentral Europe and the BalticsChadChileChinaColombiaComorosCongo, Dem. Rep.Congo, Rep.Costa RicaCote d'IvoireCroatiaCyprusCzech RepublicDenmarkDjiboutiDominicaDominican RepublicEarly-demographic dividendEast Asia & PacificEast Asia & Pacific (excluding high income)East Asia & Pacific (IDA & IBRD countries)EcuadorEgypt, Arab Rep.El SalvadorEquatorial GuineaEritreaEstoniaEthiopiaEuro areaEurope & Central AsiaEurope & Central Asia (excluding high income)Europe & Central Asia (IDA & IBRD countries)European UnionFaroe IslandsFijiFinlandFragile and conflict affected situationsFranceGabonGambia, TheGeorgiaGermanyGhanaGreeceGrenadaGuatemalaGuineaGuinea-BissauGuyanaHaitiHeavily indebted poor countries (HIPC)High incomeHondurasHong Kong SAR, ChinaHungaryIBRD onlyIcelandIDA & IBRD totalIDA blendIDA onlyIDA totalIndiaIndonesiaIran, Islamic Rep.IraqIrelandIsraelItalyJamaicaJapanJordanKazakhstanKenyaKiribatiKorea, Rep.KosovoKuwaitKyrgyz RepublicLao PDRLate-demographic dividendLatin America & Caribbean Latin America & Caribbean (excluding high income)Latin America & the Caribbean (IDA & IBRD countries)LatviaLeast developed countries: UN classificationLebanonLesothoLiberiaLibyaLithuaniaLow & middle incomeLow incomeLower middle incomeLuxembourgMacao SAR, ChinaMacedonia, FYRMadagascarMalawiMalaysiaMaldivesMaliMaltaMarshall IslandsMauritaniaMauritiusMexicoMicronesia, Fed. Sts.Middle East & North AfricaMiddle East & North Africa (excluding high income)Middle East & North Africa (IDA & IBRD countries)Middle incomeMoldovaMongoliaMontenegroMoroccoMozambiqueMyanmarNamibiaNepalNetherlandsNew ZealandNicaraguaNigerNigeriaNorth AmericaNorwayOECD membersOmanOther small statesPacific island small statesPakistanPalauPanamaPapua New GuineaParaguayPeruPhilippinesPolandPortugalPost-demographic dividendPre-demographic dividendQatarRomaniaRussian FederationRwandaSamoaSao Tome and PrincipeSaudi ArabiaSenegalSerbiaSeychellesSierra LeoneSlovak RepublicSloveniaSmall statesSolomon IslandsSouth AfricaSouth AsiaSouth Asia (IDA & IBRD)South SudanSpainSri LankaSt. Kitts and NevisSt. LuciaSt. Vincent and the GrenadinesSub-Saharan Africa Sub-Saharan Africa (excluding high income)Sub-Saharan Africa (IDA & IBRD countries)SudanSurinameSwazilandSwedenSwitzerlandSyrian Arab RepublicTajikistanTanzaniaThailandTimor-LesteTogoTongaTrinidad and TobagoTunisiaTurkeyTurkmenistanTuvaluUgandaUkraineUnited KingdomUnited StatesUpper middle incomeUruguayUzbekistanVanuatuVenezuela, RBVietnamWest Bank and GazaWorldYemen, Rep.ZambiaZimbabwe Linea del tempo:
Questa scala temporale mostra un grafico dal 1984 anno al 2016 anno. Chile. I dati fino ad 1983 anno non disponibili. Il numero di osservazioni attuali secondo i date: 22.
La fonte (nome):
Indicatori dello sviluppo mondiale
La fonte (organizzazione):
World Bank staff estimates based on IMF balance of payments data, and World Bank and OECD GDP estimates.
Categorie:
Economy & Growth, Financial Sector
sono stati aggiornati
23 apr 2017 anni
Indicatori delle variazioni dei valori per anni
Minima:
0.0
1 gen 1989 anni
Massimo:
0.064
1 gen 2013 anni
Alla data di osservazione
Valore
Variazione assoluta
La variazione rispetto al valore precedente
1 gen 1984 anni
0.005
+0.005
0.0%
1 gen 1985 anni
0.005
+0.0
2.8%
1 gen 1986 anni
0.006
+0.001
16.66%
1 gen 1987 anni
0.002
-0.004
-62.79%
1 gen 1988 anni
0.002
+0.0
5.99%
1 gen 1989 anni
0.0
-0.002
-83.03%
1 gen 1990 anni
0.005
+0.004
1.03 Mille.%
1 gen 1991 anni
0.001
-0.003
-72.33%
1 gen 2001 anni
0.017
+0.015
1.22 Mille.%
1 gen 2002 anni
0.016
0.0
-1.88%
1 gen 2003 anni
0.017
+0.001
6.19%
1 gen 2004 anni
0.015
-0.002
-13.22%
1 gen 2005 anni
0.012
-0.004
-23.96%
1 gen 2006 anni
0.01
-0.001
-9.35%
1 gen 2007 anni
0.002
-0.009
-84.53%
1 gen 2008 anni
0.001
0.0
-10.64%
1 gen 2009 anni
0.001
0.0
-3.64%
1 gen 2010 anni
0.003
+0.001
83.85%
1 gen 2013 anni
0.064
+0.062
2.41 Mille.%
1 gen 2014 anni
0.049
-0.015
-23.22%
1 gen 2015 anni
0.049
0.0
-0.87%
1 gen 2016 anni
0.053
+0.004
7.97%
Classificazione dei paesi secondo i statistiche attuali per anni


Commenti: