29
/it/
it
AIzaSyAYiBZKx7MnpbEhh9jyipgxe19OcubqV5w
April 1, 2024
248307
Sri Lanka
LKA
true
2
1
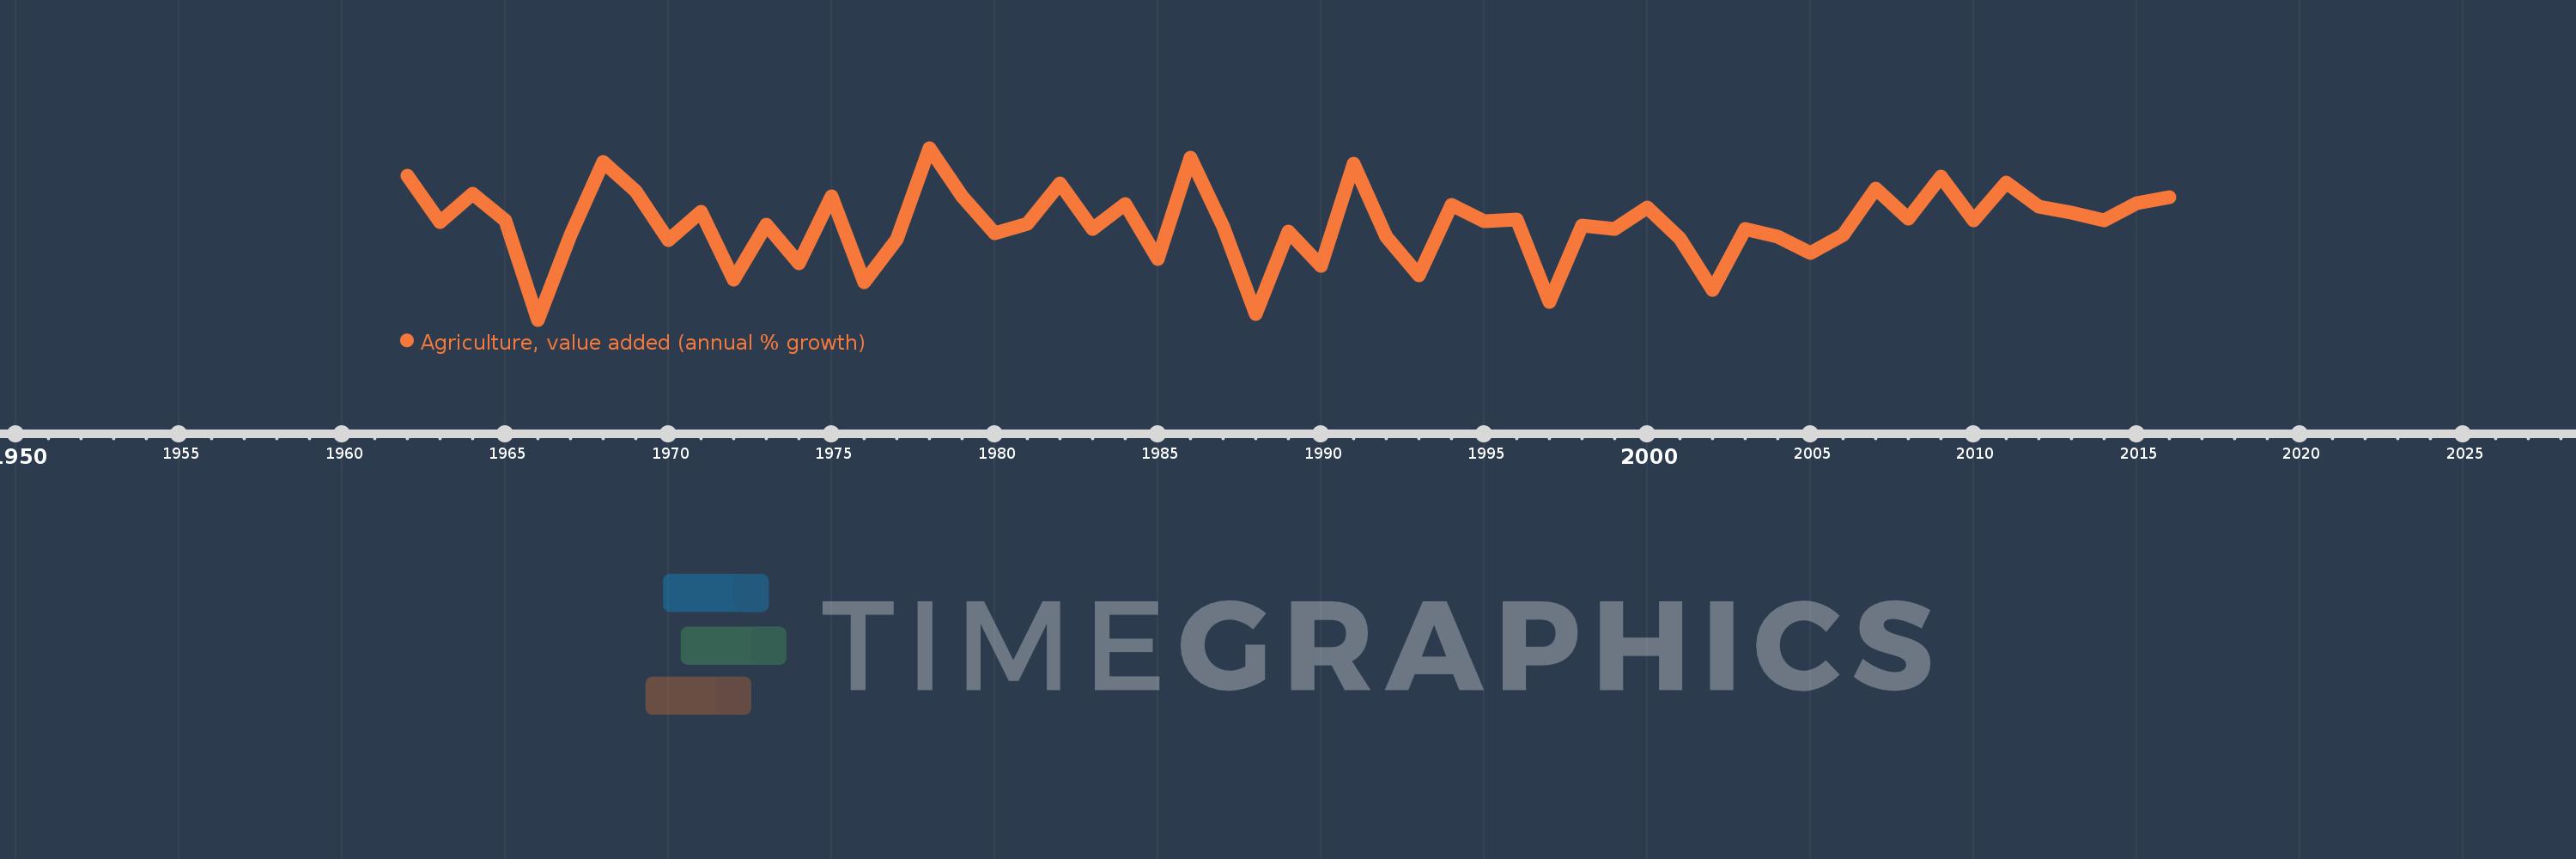
Agriculture, value added (annual % growth)
2016,2015,2014,2013,2012,2011,2010,2009,2008,2007,2006,2005,2004,2003,2002,2001,2000,1999,1998,1997,1996,1995,1994,1993,1992,1991,1990,1989,1988,1987,1986,1985,1984,1983,1982,1981,1980,1979,1978,1977,1976,1975,1974,1973,1972,1971,1970,1969,1968,1967,1966,1965,1964,1963,1962
Queste statistiche in altri paesi:
AfghanistanAlbaniaAlgeriaAntigua and BarbudaArab WorldArgentinaArmeniaAustraliaAustriaAzerbaijanBahamas, TheBahrainBangladeshBelarusBelgiumBelizeBeninBermudaBhutanBoliviaBosnia and HerzegovinaBotswanaBrazilBrunei DarussalamBulgariaBurkina FasoBurundiCabo VerdeCambodiaCameroonCanadaCaribbean small statesCayman IslandsCentral African RepublicCentral Europe and the BalticsChadChileChinaColombiaComorosCongo, Dem. Rep.Congo, Rep.Costa RicaCote d'IvoireCroatiaCubaCyprusCzech RepublicDenmarkDjiboutiDominicaDominican RepublicEarly-demographic dividendEast Asia & PacificEast Asia & Pacific (excluding high income)East Asia & Pacific (IDA & IBRD countries)EcuadorEgypt, Arab Rep.El SalvadorEquatorial GuineaEritreaEstoniaEthiopiaEuro areaEurope & Central AsiaEurope & Central Asia (excluding high income)Europe & Central Asia (IDA & IBRD countries)European UnionFijiFinlandFragile and conflict affected situationsFranceGabonGambia, TheGeorgiaGermanyGhanaGreeceGrenadaGuatemalaGuineaGuinea-BissauGuyanaHaitiHeavily indebted poor countries (HIPC)High incomeHondurasHong Kong SAR, ChinaHungaryIBRD onlyIcelandIDA & IBRD totalIDA blendIDA onlyIDA totalIndiaIndonesiaIran, Islamic Rep.IraqIrelandItalyJamaicaJapanJordanKazakhstanKenyaKiribatiKorea, Rep.KosovoKuwaitKyrgyz RepublicLao PDRLate-demographic dividendLatin America & Caribbean Latin America & Caribbean (excluding high income)Latin America & the Caribbean (IDA & IBRD countries)LatviaLeast developed countries: UN classificationLebanonLesothoLiberiaLithuaniaLow & middle incomeLow incomeLower middle incomeLuxembourgMacedonia, FYRMadagascarMalawiMalaysiaMaldivesMaliMarshall IslandsMauritaniaMauritiusMexicoMicronesia, Fed. Sts.Middle East & North AfricaMiddle East & North Africa (excluding high income)Middle East & North Africa (IDA & IBRD countries)Middle incomeMoldovaMongoliaMontenegroMoroccoMozambiqueMyanmarNamibiaNepalNetherlandsNew ZealandNicaraguaNigerNigeriaNorth AmericaNorwayOECD membersOmanOther small statesPakistanPalauPanamaPapua New GuineaParaguayPeruPhilippinesPolandPortugalPost-demographic dividendPre-demographic dividendPuerto RicoQatarRomaniaRussian FederationRwandaSamoaSao Tome and PrincipeSaudi ArabiaSenegalSerbiaSeychellesSierra LeoneSingaporeSlovak RepublicSloveniaSmall statesSolomon IslandsSomaliaSouth AfricaSouth AsiaSouth Asia (IDA & IBRD)SpainSri LankaSt. Kitts and NevisSt. LuciaSt. Vincent and the GrenadinesSub-Saharan Africa Sub-Saharan Africa (excluding high income)Sub-Saharan Africa (IDA & IBRD countries)SudanSurinameSwazilandSwedenSwitzerlandSyrian Arab RepublicTajikistanTanzaniaThailandTimor-LesteTogoTongaTrinidad and TobagoTunisiaTurkeyTurkmenistanTuvaluUgandaUkraineUnited Arab EmiratesUnited KingdomUnited StatesUpper middle incomeUruguayUzbekistanVanuatuVenezuela, RBVietnamWest Bank and GazaWorldZambiaZimbabwe Linea del tempo:
Questa scala temporale mostra un grafico dal 1962 anno al 2016 anno. Sri Lanka. I dati fino ad 1961 anno non disponibili. Il numero di osservazioni attuali secondo i date: 55.
La fonte (nome):
Indicatori dello sviluppo mondiale
La fonte (organizzazione):
World Bank national accounts data, and OECD National Accounts data files.
Categorie:
Economy & Growth
sono stati aggiornati
23 apr 2017 anni
Indicatori delle variazioni dei valori per anni
Minima:
-6.474
1 gen 1966 anni
Massimo:
10.299
1 gen 1978 anni
Alla data di osservazione
Valore
Variazione assoluta
La variazione rispetto al valore precedente
1 gen 1962 anni
7.627
+7.627
0.0%
1 gen 1963 anni
3.072
-4.554
-59.72%
1 gen 1964 anni
5.831
+2.759
89.79%
1 gen 1965 anni
3.262
-2.569
-44.06%
1 gen 1966 anni
-6.474
-9.736
-298.48%
1 gen 1967 anni
1.77
+8.244
-127.34%
1 gen 1968 anni
8.932
+7.162
404.66%
1 gen 1969 anni
6.045
-2.886
-32.32%
1 gen 1970 anni
1.316
-4.729
-78.23%
1 gen 1971 anni
4.089
+2.773
210.72%
1 gen 1972 anni
-2.572
-6.661
-162.91%
1 gen 1973 anni
2.833
+5.405
-210.14%
1 gen 1974 anni
-0.952
-3.785
-133.6%
1 gen 1975 anni
5.58
+6.532
-686.13%
1 gen 1976 anni
-2.772
-8.352
-149.68%
1 gen 1977 anni
1.378
+4.15
-149.69%
1 gen 1978 anni
10.299
+8.922
647.62%
1 gen 1979 anni
5.592
-4.707
-45.7%
1 gen 1980 anni
1.94
-3.652
-65.31%
1 gen 1981 anni
2.911
+0.971
50.06%
1 gen 1982 anni
6.818
+3.906
134.17%
1 gen 1983 anni
2.359
-4.459
-65.4%
1 gen 1984 anni
4.826
+2.467
104.6%
1 gen 1985 anni
-0.567
-5.393
-111.74%
1 gen 1986 anni
9.367
+9.934
-1.75 Mille.%
1 gen 1987 anni
2.609
-6.758
-72.15%
1 gen 1988 anni
-5.954
-8.563
-328.19%
1 gen 1989 anni
2.146
+8.1
-136.05%
1 gen 1990 anni
-1.231
-3.377
-157.34%
1 gen 1991 anni
8.723
+9.954
-808.81%
1 gen 1992 anni
1.627
-7.096
-81.35%
1 gen 1993 anni
-2.147
-3.774
-231.96%
1 gen 1994 anni
4.732
+6.879
-320.44%
1 gen 1995 anni
3.109
-1.623
-34.31%
1 gen 1996 anni
3.306
+0.197
6.35%
1 gen 1997 anni
-4.775
-8.081
-244.43%
1 gen 1998 anni
2.726
+7.501
-157.09%
1 gen 1999 anni
2.359
-0.367
-13.46%
1 gen 2000 anni
4.528
+2.169
91.94%
1 gen 2001 anni
1.489
-3.039
-67.12%
1 gen 2002 anni
-3.524
-5.012
-336.71%
1 gen 2003 anni
2.384
+5.908
-167.66%
1 gen 2004 anni
1.676
-0.708
-29.69%
1 gen 2005 anni
0.002
-1.674
-99.87%
1 gen 2006 anni
1.817
+1.814
84.51 Mille.%
1 gen 2007 anni
6.325
+4.508
248.16%
1 gen 2008 anni
3.392
-2.932
-46.36%
1 gen 2009 anni
7.533
+4.14
122.06%
1 gen 2010 anni
3.218
-4.315
-57.28%
1 gen 2011 anni
6.951
+3.733
116.02%
1 gen 2012 anni
4.595
-2.356
-33.9%
1 gen 2013 anni
3.946
-0.649
-14.12%
1 gen 2014 anni
3.246
-0.7
-17.74%
1 gen 2015 anni
4.875
+1.629
50.17%
1 gen 2016 anni
5.519
+0.644
13.22%
Classificazione dei paesi secondo i statistiche attuali per anni


Commenti: