29
/it/
it
AIzaSyAYiBZKx7MnpbEhh9jyipgxe19OcubqV5w
April 1, 2024
24671
Caribbean small states
CSS
false
2
1
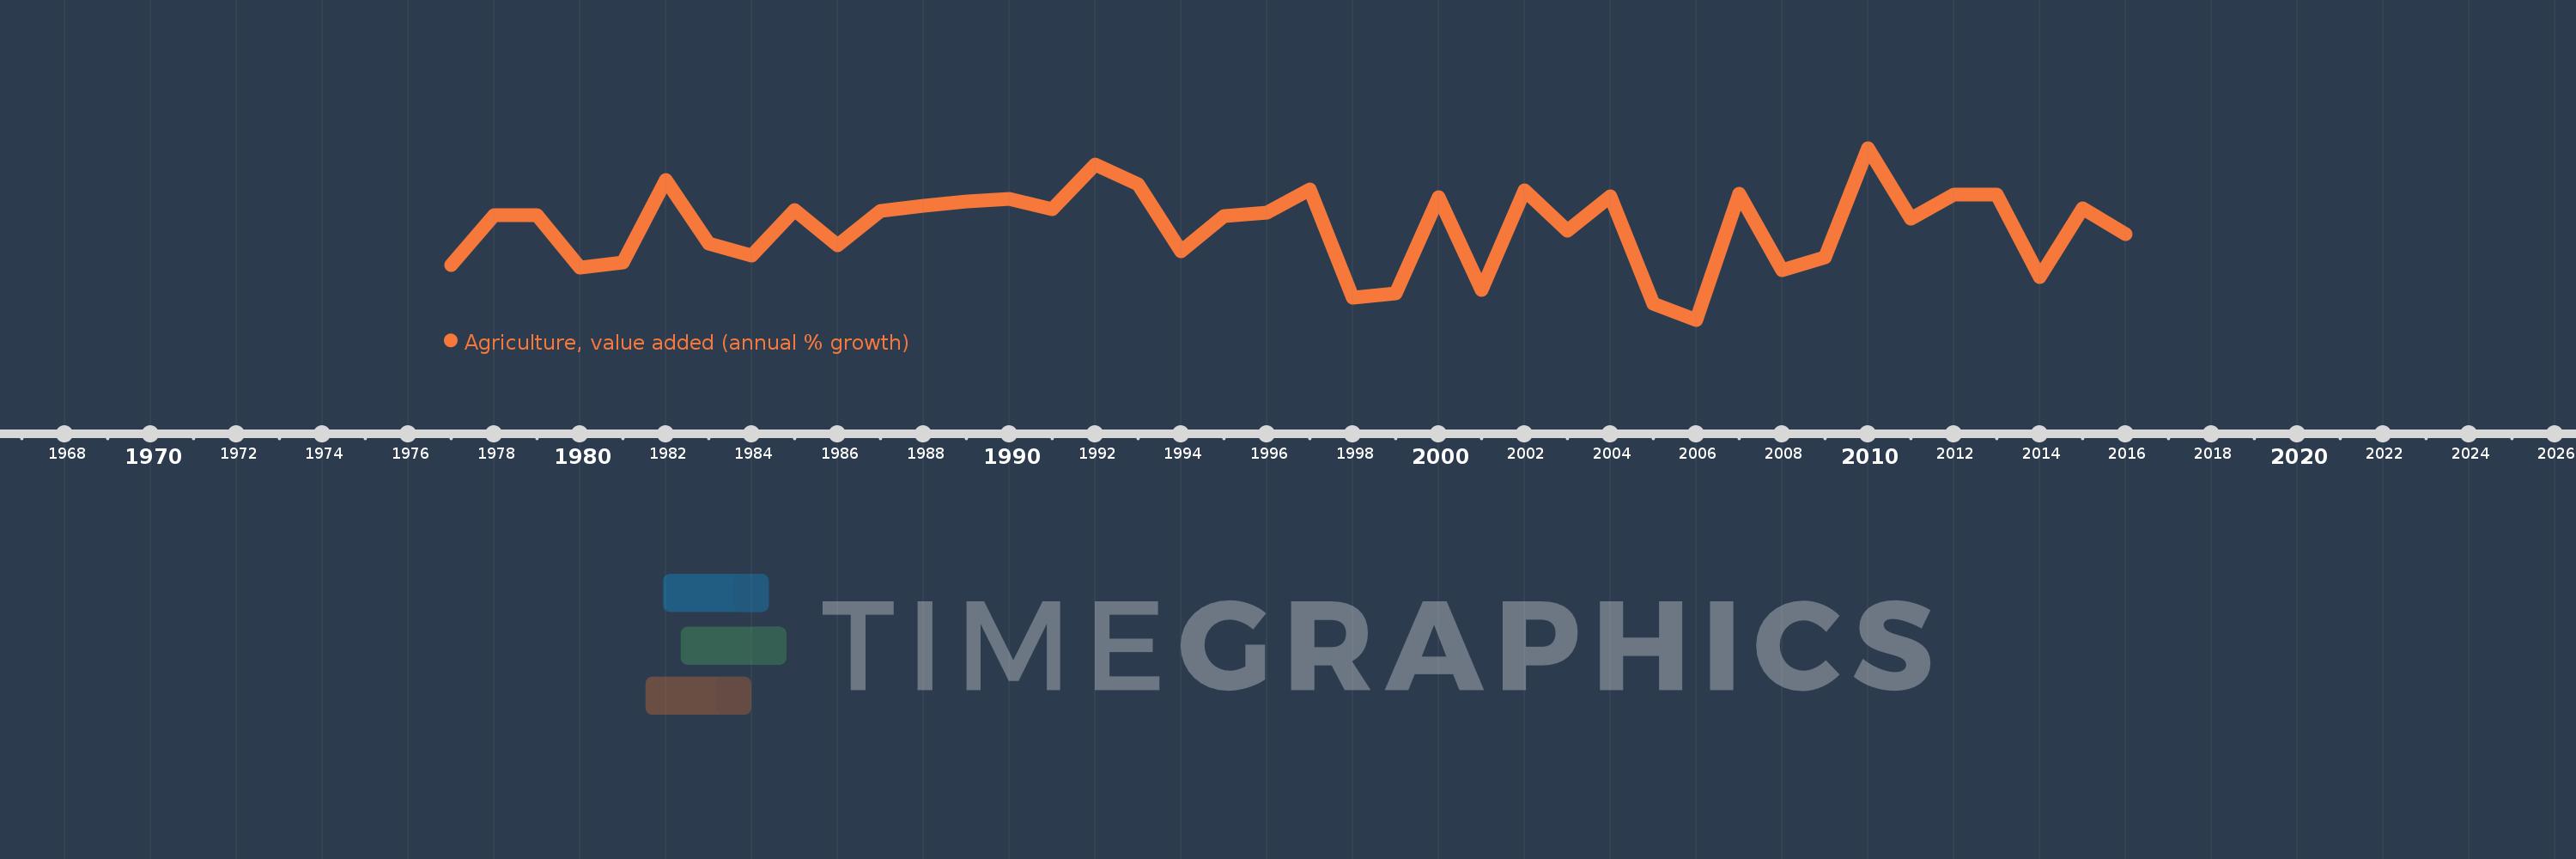
Agriculture, value added (annual % growth)
2016,2015,2014,2013,2012,2011,2010,2009,2008,2007,2006,2005,2004,2003,2002,2001,2000,1999,1998,1997,1996,1995,1994,1993,1992,1991,1990,1989,1988,1987,1986,1985,1984,1983,1982,1981,1980,1979,1978,1977
Queste statistiche in altri paesi:
AfghanistanAlbaniaAlgeriaAntigua and BarbudaArab WorldArgentinaArmeniaAustraliaAustriaAzerbaijanBahamas, TheBahrainBangladeshBelarusBelgiumBelizeBeninBermudaBhutanBoliviaBosnia and HerzegovinaBotswanaBrazilBrunei DarussalamBulgariaBurkina FasoBurundiCabo VerdeCambodiaCameroonCanadaCaribbean small statesCayman IslandsCentral African RepublicCentral Europe and the BalticsChadChileChinaColombiaComorosCongo, Dem. Rep.Congo, Rep.Costa RicaCote d'IvoireCroatiaCubaCyprusCzech RepublicDenmarkDjiboutiDominicaDominican RepublicEarly-demographic dividendEast Asia & PacificEast Asia & Pacific (excluding high income)East Asia & Pacific (IDA & IBRD countries)EcuadorEgypt, Arab Rep.El SalvadorEquatorial GuineaEritreaEstoniaEthiopiaEuro areaEurope & Central AsiaEurope & Central Asia (excluding high income)Europe & Central Asia (IDA & IBRD countries)European UnionFijiFinlandFragile and conflict affected situationsFranceGabonGambia, TheGeorgiaGermanyGhanaGreeceGrenadaGuatemalaGuineaGuinea-BissauGuyanaHaitiHeavily indebted poor countries (HIPC)High incomeHondurasHong Kong SAR, ChinaHungaryIBRD onlyIcelandIDA & IBRD totalIDA blendIDA onlyIDA totalIndiaIndonesiaIran, Islamic Rep.IraqIrelandItalyJamaicaJapanJordanKazakhstanKenyaKiribatiKorea, Rep.KosovoKuwaitKyrgyz RepublicLao PDRLate-demographic dividendLatin America & Caribbean Latin America & Caribbean (excluding high income)Latin America & the Caribbean (IDA & IBRD countries)LatviaLeast developed countries: UN classificationLebanonLesothoLiberiaLithuaniaLow & middle incomeLow incomeLower middle incomeLuxembourgMacedonia, FYRMadagascarMalawiMalaysiaMaldivesMaliMarshall IslandsMauritaniaMauritiusMexicoMicronesia, Fed. Sts.Middle East & North AfricaMiddle East & North Africa (excluding high income)Middle East & North Africa (IDA & IBRD countries)Middle incomeMoldovaMongoliaMontenegroMoroccoMozambiqueMyanmarNamibiaNepalNetherlandsNew ZealandNicaraguaNigerNigeriaNorth AmericaNorwayOECD membersOmanOther small statesPakistanPalauPanamaPapua New GuineaParaguayPeruPhilippinesPolandPortugalPost-demographic dividendPre-demographic dividendPuerto RicoQatarRomaniaRussian FederationRwandaSamoaSao Tome and PrincipeSaudi ArabiaSenegalSerbiaSeychellesSierra LeoneSingaporeSlovak RepublicSloveniaSmall statesSolomon IslandsSomaliaSouth AfricaSouth AsiaSouth Asia (IDA & IBRD)SpainSri LankaSt. Kitts and NevisSt. LuciaSt. Vincent and the GrenadinesSub-Saharan Africa Sub-Saharan Africa (excluding high income)Sub-Saharan Africa (IDA & IBRD countries)SudanSurinameSwazilandSwedenSwitzerlandSyrian Arab RepublicTajikistanTanzaniaThailandTimor-LesteTogoTongaTrinidad and TobagoTunisiaTurkeyTurkmenistanTuvaluUgandaUkraineUnited Arab EmiratesUnited KingdomUnited StatesUpper middle incomeUruguayUzbekistanVanuatuVenezuela, RBVietnamWest Bank and GazaWorldZambiaZimbabwe Linea del tempo:
Questa scala temporale mostra un grafico dal 1977 anno al 2016 anno. Caribbean small states. I dati fino ad 1976 anno non disponibili. Il numero di osservazioni attuali secondo i date: 40.
La fonte (nome):
Indicatori dello sviluppo mondiale
La fonte (organizzazione):
World Bank national accounts data, and OECD National Accounts data files.
Categorie:
Economy & Growth
sono stati aggiornati
23 apr 2017 anni
Indicatori delle variazioni dei valori per anni
Minima:
-7.662
1 gen 2006 anni
Massimo:
8.276
1 gen 2010 anni
Alla data di osservazione
Valore
Variazione assoluta
La variazione rispetto al valore precedente
1 gen 1977 anni
-2.547
-2.547
0.0%
1 gen 1978 anni
2.025
+4.573
-179.51%
1 gen 1979 anni
2.066
+0.04
1.98%
1 gen 1980 anni
-2.8
-4.865
-235.55%
1 gen 1981 anni
-2.366
+0.434
-15.51%
1 gen 1982 anni
5.319
+7.684
-324.83%
1 gen 1983 anni
-0.578
-5.896
-110.86%
1 gen 1984 anni
-1.737
-1.16
200.83%
1 gen 1985 anni
2.491
+4.228
-243.35%
1 gen 1986 anni
-0.722
-3.213
-129.0%
1 gen 1987 anni
2.409
+3.131
-433.56%
1 gen 1988 anni
2.883
+0.473
19.65%
1 gen 1989 anni
3.335
+0.453
15.7%
1 gen 1990 anni
3.572
+0.237
7.1%
1 gen 1991 anni
2.568
-1.004
-28.11%
1 gen 1992 anni
6.745
+4.177
162.66%
1 gen 1993 anni
4.937
-1.808
-26.8%
1 gen 1994 anni
-1.289
-6.225
-126.1%
1 gen 1995 anni
1.98
+3.268
-253.63%
1 gen 1996 anni
2.315
+0.335
16.93%
1 gen 1997 anni
4.398
+2.083
89.98%
1 gen 1998 anni
-5.585
-9.982
-227.0%
1 gen 1999 anni
-5.204
+0.381
-6.82%
1 gen 2000 anni
3.749
+8.953
-172.03%
1 gen 2001 anni
-4.864
-8.613
-229.75%
1 gen 2002 anni
4.328
+9.191
-188.97%
1 gen 2003 anni
0.625
-3.702
-85.55%
1 gen 2004 anni
3.794
+3.169
506.94%
1 gen 2005 anni
-6.14
-9.934
-261.8%
1 gen 2006 anni
-7.662
-1.522
24.8%
1 gen 2007 anni
3.994
+11.656
-152.12%
1 gen 2008 anni
-3.076
-7.069
-177.02%
1 gen 2009 anni
-1.87
+1.205
-39.19%
1 gen 2010 anni
8.276
+10.146
-542.45%
1 gen 2011 anni
1.693
-6.583
-79.54%
1 gen 2012 anni
3.92
+2.228
131.59%
1 gen 2013 anni
3.978
+0.057
1.46%
1 gen 2014 anni
-3.708
-7.686
-193.22%
1 gen 2015 anni
2.69
+6.398
-172.55%
1 gen 2016 anni
0.264
-2.426
-90.18%
Classificazione dei paesi secondo i statistiche attuali per anni


Commenti: