29
/it/
it
AIzaSyAYiBZKx7MnpbEhh9jyipgxe19OcubqV5w
April 1, 2024
125783
El Salvador
SLV
true
2
1
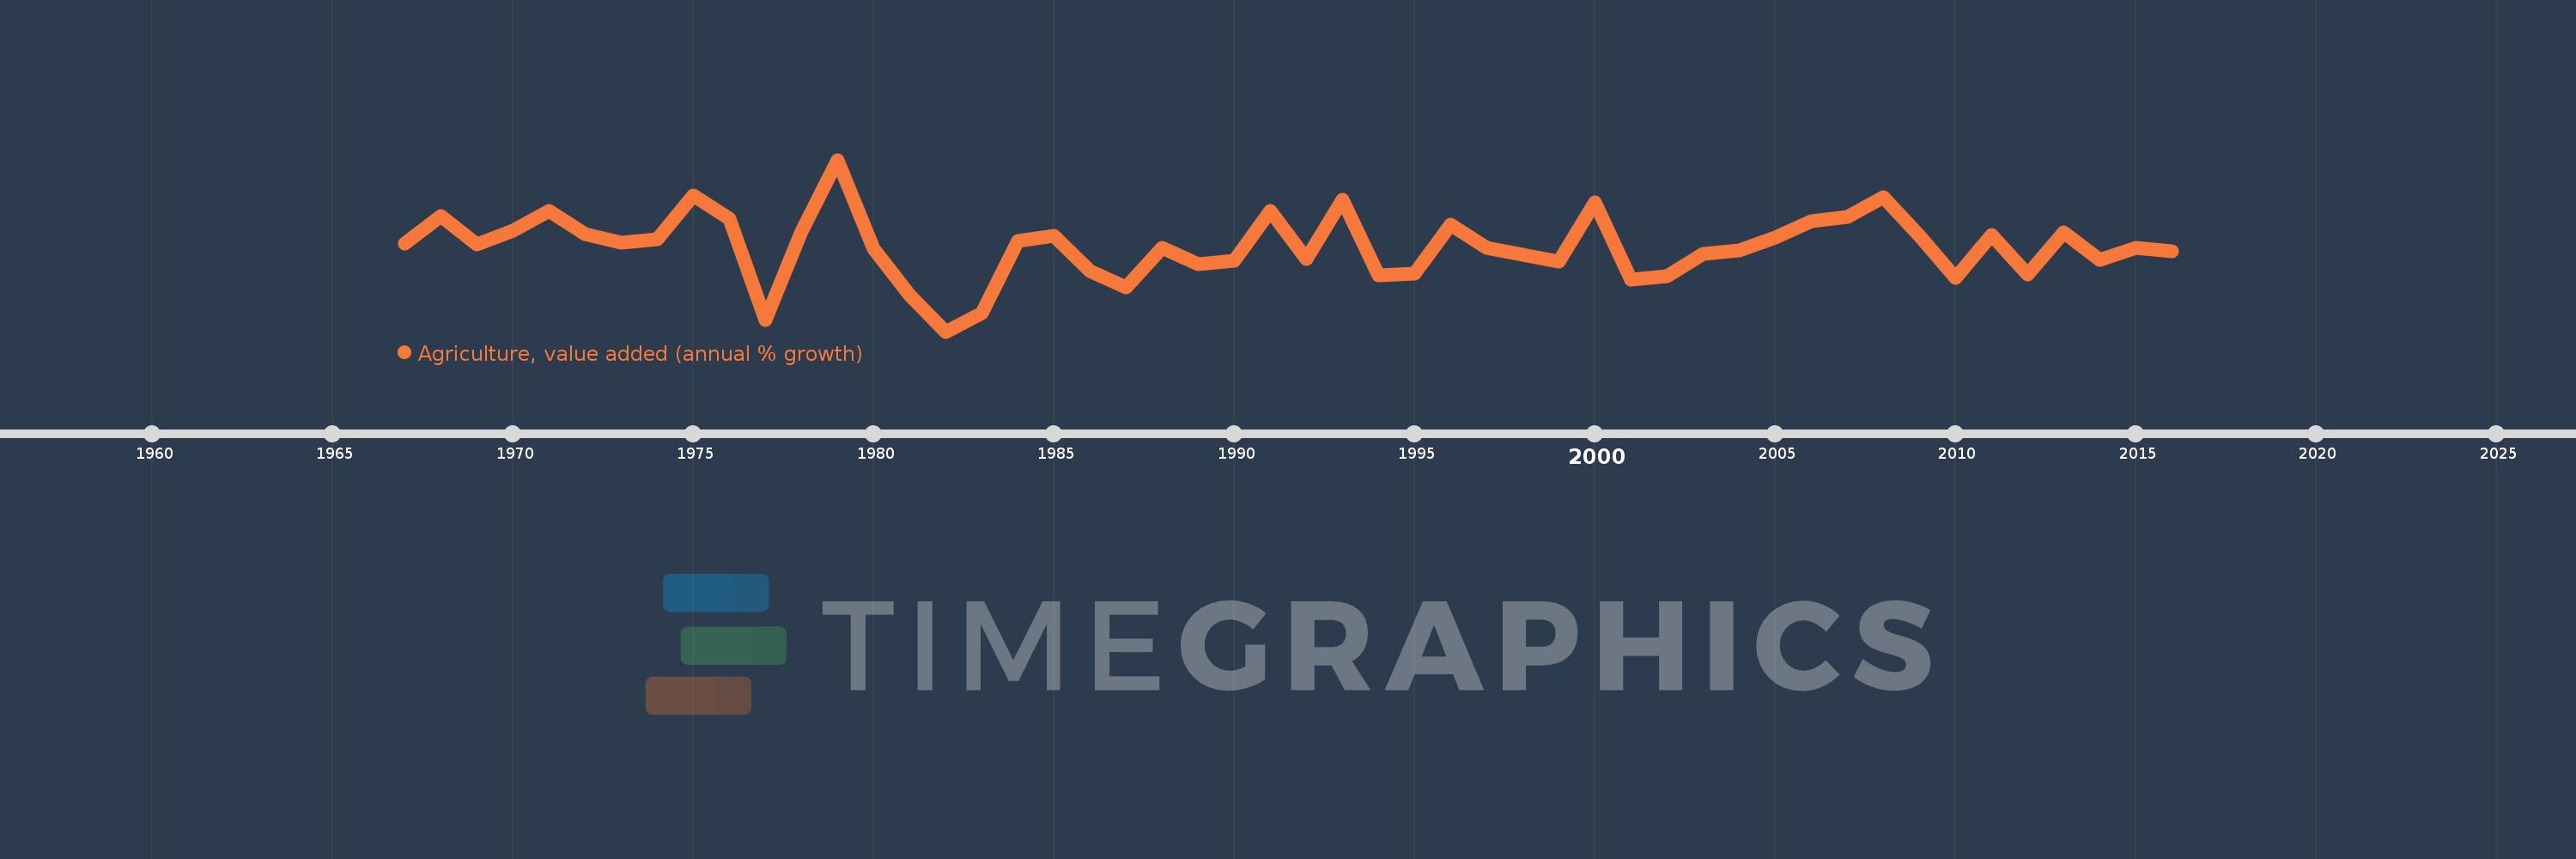
Agriculture, value added (annual % growth)
2016,2015,2014,2013,2012,2011,2010,2009,2008,2007,2006,2005,2004,2003,2002,2001,2000,1999,1998,1997,1996,1995,1994,1993,1992,1991,1990,1989,1988,1987,1986,1985,1984,1983,1982,1981,1980,1979,1978,1977,1976,1975,1974,1973,1972,1971,1970,1969,1968,1967
Queste statistiche in altri paesi:
AfghanistanAlbaniaAlgeriaAntigua and BarbudaArab WorldArgentinaArmeniaAustraliaAustriaAzerbaijanBahamas, TheBahrainBangladeshBelarusBelgiumBelizeBeninBermudaBhutanBoliviaBosnia and HerzegovinaBotswanaBrazilBrunei DarussalamBulgariaBurkina FasoBurundiCabo VerdeCambodiaCameroonCanadaCaribbean small statesCayman IslandsCentral African RepublicCentral Europe and the BalticsChadChileChinaColombiaComorosCongo, Dem. Rep.Congo, Rep.Costa RicaCote d'IvoireCroatiaCubaCyprusCzech RepublicDenmarkDjiboutiDominicaDominican RepublicEarly-demographic dividendEast Asia & PacificEast Asia & Pacific (excluding high income)East Asia & Pacific (IDA & IBRD countries)EcuadorEgypt, Arab Rep.El SalvadorEquatorial GuineaEritreaEstoniaEthiopiaEuro areaEurope & Central AsiaEurope & Central Asia (excluding high income)Europe & Central Asia (IDA & IBRD countries)European UnionFijiFinlandFragile and conflict affected situationsFranceGabonGambia, TheGeorgiaGermanyGhanaGreeceGrenadaGuatemalaGuineaGuinea-BissauGuyanaHaitiHeavily indebted poor countries (HIPC)High incomeHondurasHong Kong SAR, ChinaHungaryIBRD onlyIcelandIDA & IBRD totalIDA blendIDA onlyIDA totalIndiaIndonesiaIran, Islamic Rep.IraqIrelandItalyJamaicaJapanJordanKazakhstanKenyaKiribatiKorea, Rep.KosovoKuwaitKyrgyz RepublicLao PDRLate-demographic dividendLatin America & Caribbean Latin America & Caribbean (excluding high income)Latin America & the Caribbean (IDA & IBRD countries)LatviaLeast developed countries: UN classificationLebanonLesothoLiberiaLithuaniaLow & middle incomeLow incomeLower middle incomeLuxembourgMacedonia, FYRMadagascarMalawiMalaysiaMaldivesMaliMarshall IslandsMauritaniaMauritiusMexicoMicronesia, Fed. Sts.Middle East & North AfricaMiddle East & North Africa (excluding high income)Middle East & North Africa (IDA & IBRD countries)Middle incomeMoldovaMongoliaMontenegroMoroccoMozambiqueMyanmarNamibiaNepalNetherlandsNew ZealandNicaraguaNigerNigeriaNorth AmericaNorwayOECD membersOmanOther small statesPakistanPalauPanamaPapua New GuineaParaguayPeruPhilippinesPolandPortugalPost-demographic dividendPre-demographic dividendPuerto RicoQatarRomaniaRussian FederationRwandaSamoaSao Tome and PrincipeSaudi ArabiaSenegalSerbiaSeychellesSierra LeoneSingaporeSlovak RepublicSloveniaSmall statesSolomon IslandsSomaliaSouth AfricaSouth AsiaSouth Asia (IDA & IBRD)SpainSri LankaSt. Kitts and NevisSt. LuciaSt. Vincent and the GrenadinesSub-Saharan Africa Sub-Saharan Africa (excluding high income)Sub-Saharan Africa (IDA & IBRD countries)SudanSurinameSwazilandSwedenSwitzerlandSyrian Arab RepublicTajikistanTanzaniaThailandTimor-LesteTogoTongaTrinidad and TobagoTunisiaTurkeyTurkmenistanTuvaluUgandaUkraineUnited Arab EmiratesUnited KingdomUnited StatesUpper middle incomeUruguayUzbekistanVanuatuVenezuela, RBVietnamWest Bank and GazaWorldZambiaZimbabwe Linea del tempo:
Questa scala temporale mostra un grafico dal 1967 anno al 2016 anno. El Salvador. I dati fino ad 1966 anno non disponibili. Il numero di osservazioni attuali secondo i date: 50.
La fonte (nome):
Indicatori dello sviluppo mondiale
La fonte (organizzazione):
World Bank national accounts data, and OECD National Accounts data files.
Categorie:
Economy & Growth
sono stati aggiornati
23 apr 2017 anni
Indicatori delle variazioni dei valori per anni
Minima:
-10.51
1 gen 1982 anni
Massimo:
13.704
1 gen 1979 anni
Alla data di osservazione
Valore
Variazione assoluta
La variazione rispetto al valore precedente
1 gen 1967 anni
1.953
+1.953
0.0%
1 gen 1968 anni
5.765
+3.812
195.22%
1 gen 1969 anni
1.793
-3.972
-68.9%
1 gen 1970 anni
3.681
+1.888
105.29%
1 gen 1971 anni
6.557
+2.876
78.13%
1 gen 1972 anni
3.178
-3.379
-51.53%
1 gen 1973 anni
2.071
-1.108
-34.85%
1 gen 1974 anni
2.549
+0.478
23.07%
1 gen 1975 anni
8.723
+6.174
242.26%
1 gen 1976 anni
5.421
-3.301
-37.85%
1 gen 1977 anni
-8.89
-14.311
-263.98%
1 gen 1978 anni
3.553
+12.442
-139.96%
1 gen 1979 anni
13.704
+10.152
285.77%
1 gen 1980 anni
1.186
-12.518
-91.35%
1 gen 1981 anni
-5.362
-6.548
-552.04%
1 gen 1982 anni
-10.51
-5.149
96.03%
1 gen 1983 anni
-7.861
+2.649
-25.21%
1 gen 1984 anni
2.316
+10.176
-129.46%
1 gen 1985 anni
3.027
+0.711
30.72%
1 gen 1986 anni
-2.003
-5.03
-166.19%
1 gen 1987 anni
-4.252
-2.248
112.23%
1 gen 1988 anni
1.326
+5.578
-131.2%
1 gen 1989 anni
-1.017
-2.343
-176.65%
1 gen 1990 anni
-0.56
+0.456
-44.89%
1 gen 1991 anni
6.534
+7.095
-1.27 Mille.%
1 gen 1992 anni
-0.28
-6.815
-104.29%
1 gen 1993 anni
8.036
+8.316
-2.97 Mille.%
1 gen 1994 anni
-2.577
-10.614
-132.07%
1 gen 1995 anni
-2.379
+0.199
-7.71%
1 gen 1996 anni
4.517
+6.896
-289.88%
1 gen 1997 anni
1.262
-3.254
-72.05%
1 gen 1998 anni
0.348
-0.914
-72.42%
1 gen 1999 anni
-0.694
-1.042
-299.31%
1 gen 2000 anni
7.664
+8.358
-1.2 Mille.%
1 gen 2001 anni
-3.14
-10.804
-140.98%
1 gen 2002 anni
-2.648
+0.493
-15.69%
1 gen 2003 anni
0.4
+3.047
-115.09%
1 gen 2004 anni
0.896
+0.496
124.1%
1 gen 2005 anni
2.805
+1.91
213.24%
1 gen 2006 anni
5.074
+2.269
80.86%
1 gen 2007 anni
5.671
+0.597
11.77%
1 gen 2008 anni
8.458
+2.787
49.14%
1 gen 2009 anni
3.036
-5.422
-64.1%
1 gen 2010 anni
-2.895
-5.931
-195.36%
1 gen 2011 anni
3.123
+6.018
-207.87%
1 gen 2012 anni
-2.462
-5.585
-178.84%
1 gen 2013 anni
3.457
+5.919
-240.39%
1 gen 2014 anni
-0.442
-3.899
-112.79%
1 gen 2015 anni
1.315
+1.757
-397.47%
1 gen 2016 anni
0.775
-0.54
-41.04%
Classificazione dei paesi secondo i statistiche attuali per anni


Commenti: