29
/it/
it
AIzaSyAYiBZKx7MnpbEhh9jyipgxe19OcubqV5w
April 1, 2024
240681
Singapore
SGP
true
2
1
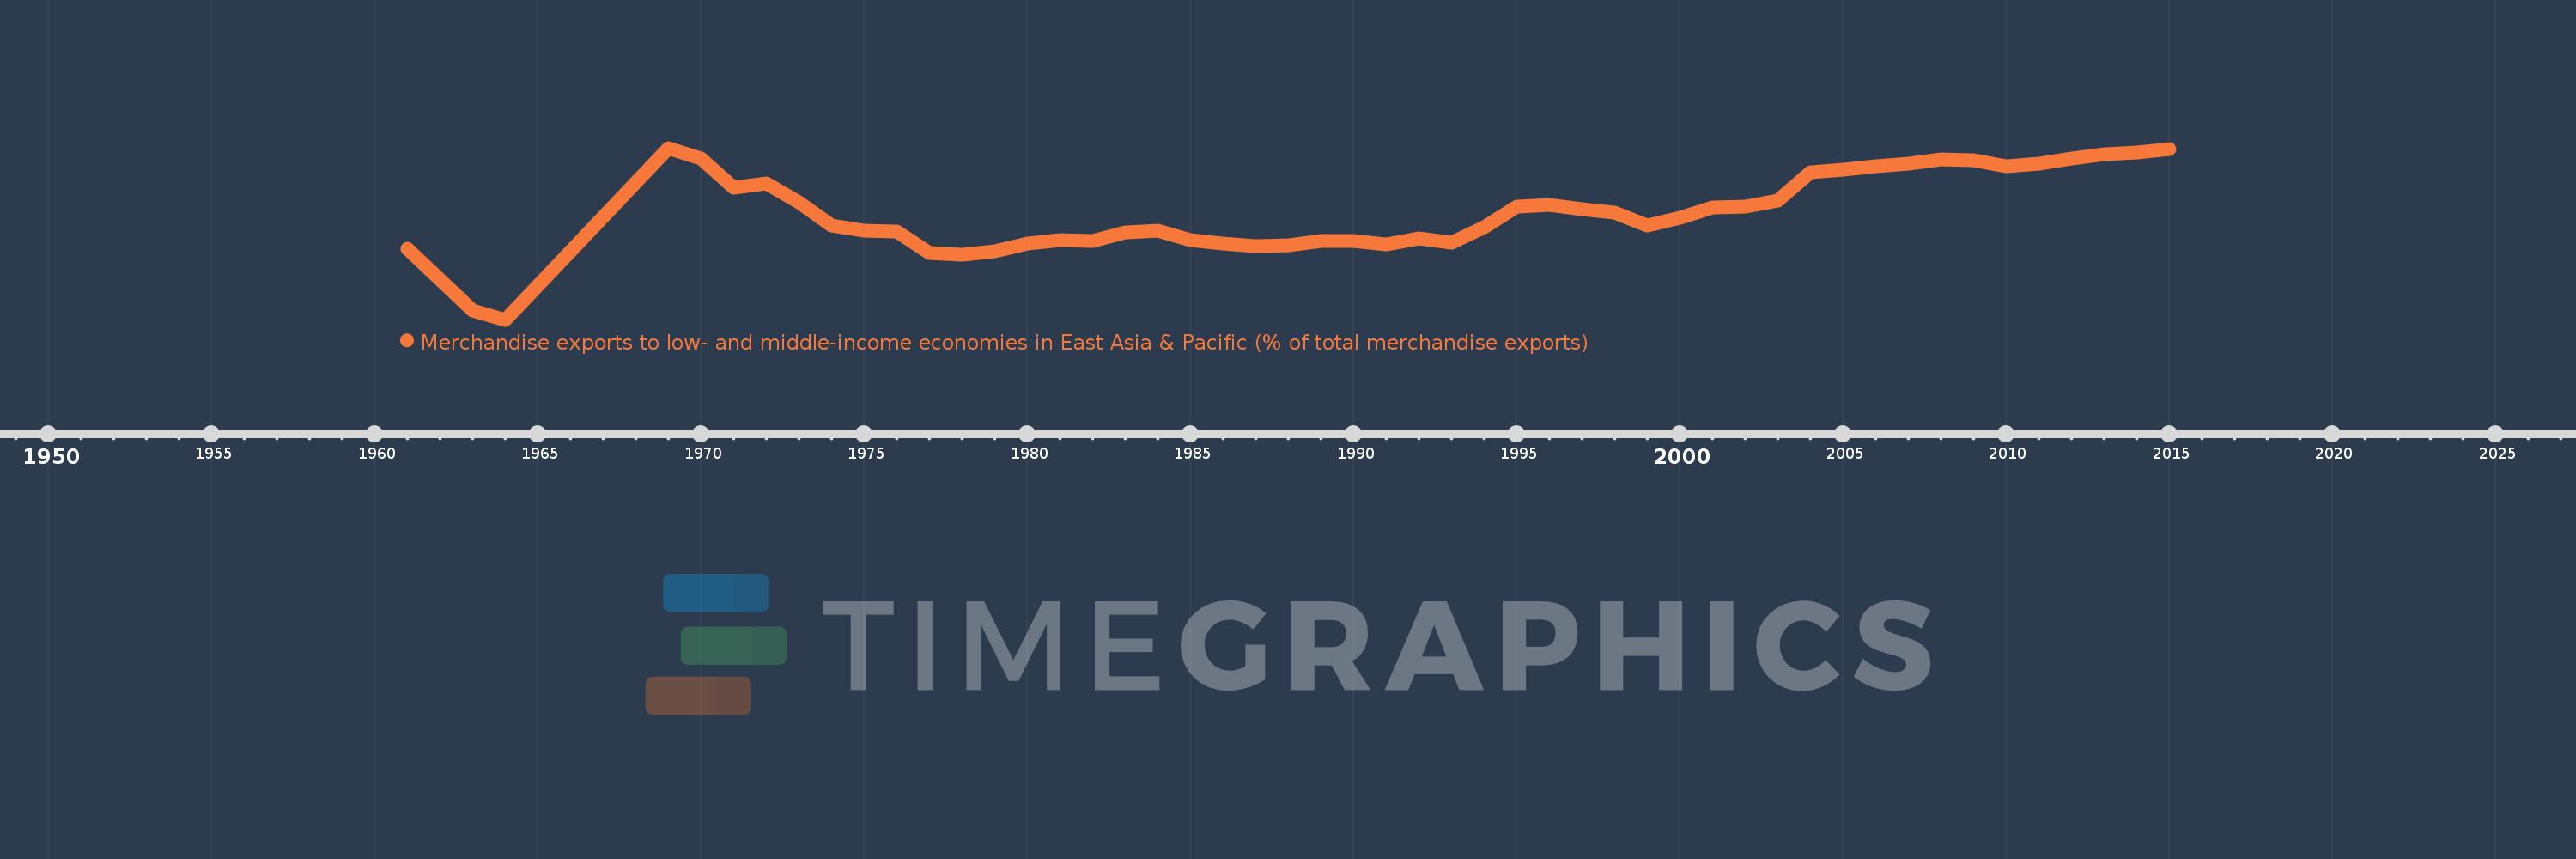
Merchandise exports to low- and middle-income economies in East Asia & Pacific (% of total merchandise exports)
2015,2014,2013,2012,2011,2010,2009,2008,2007,2006,2005,2004,2003,2002,2001,2000,1999,1998,1997,1996,1995,1994,1993,1992,1991,1990,1989,1988,1987,1986,1985,1984,1983,1982,1981,1980,1979,1978,1977,1976,1975,1974,1973,1972,1971,1970,1969,1964,1963,1961
Queste statistiche in altri paesi:
AfghanistanAlbaniaAlgeriaArab WorldArgentinaAustraliaAustriaAzerbaijanBahamas, TheBahrainBangladeshBarbadosBelarusBelgiumBermudaBrazilBrunei DarussalamBulgariaCabo VerdeCambodiaCameroonCanadaCaribbean small statesCentral Europe and the BalticsChileChinaColombiaCosta RicaCote d'IvoireCroatiaCubaCyprusCzech RepublicDenmarkDominicaDominican RepublicEarly-demographic dividendEast Asia & PacificEast Asia & Pacific (excluding high income)East Asia & Pacific (IDA & IBRD countries)EcuadorEgypt, Arab Rep.El SalvadorEstoniaEthiopiaEuro areaEurope & Central AsiaEurope & Central Asia (excluding high income)Europe & Central Asia (IDA & IBRD countries)European UnionFijiFinlandFragile and conflict affected situationsFranceGermanyGhanaGreeceGuatemalaGuyanaHeavily indebted poor countries (HIPC)High incomeHondurasHong Kong SAR, ChinaHungaryIBRD onlyIcelandIDA & IBRD totalIDA blendIDA onlyIDA totalIndiaIndonesiaIran, Islamic Rep.IraqIrelandIsraelItalyJamaicaJapanJordanKazakhstanKenyaKorea, Dem. People’s Rep.Korea, Rep.KuwaitLate-demographic dividendLatin America & Caribbean Latin America & Caribbean (excluding high income)Latin America & the Caribbean (IDA & IBRD countries)LatviaLeast developed countries: UN classificationLebanonLithuaniaLow & middle incomeLow incomeLower middle incomeLuxembourgMacao SAR, ChinaMacedonia, FYRMadagascarMalaysiaMaltaMauritiusMexicoMiddle East & North AfricaMiddle East & North Africa (excluding high income)Middle East & North Africa (IDA & IBRD countries)Middle incomeMoldovaMontenegroMoroccoMozambiqueMyanmarNetherlandsNew CaledoniaNew ZealandNigeriaNorth AmericaNorwayOECD membersOmanOther small statesPacific island small statesPakistanPapua New GuineaParaguayPeruPhilippinesPolandPortugalPost-demographic dividendPre-demographic dividendQatarRomaniaRussian FederationSaudi ArabiaSenegalSerbiaSingaporeSlovak RepublicSloveniaSmall statesSolomon IslandsSomaliaSouth AfricaSouth AsiaSouth Asia (IDA & IBRD)SpainSri LankaSt. LuciaSub-Saharan Africa Sub-Saharan Africa (excluding high income)Sub-Saharan Africa (IDA & IBRD countries)SurinameSwedenSwitzerlandSyrian Arab RepublicTanzaniaThailandTogoTongaTrinidad and TobagoTunisiaTurkeyUgandaUkraineUnited Arab EmiratesUnited KingdomUnited StatesUpper middle incomeVenezuela, RBVietnamWorldYemen, Rep.ZambiaZimbabwe Linea del tempo:
Questa scala temporale mostra un grafico dal 1961 anno al 2015 anno. Singapore. I dati fino ad 1960 anno non disponibili. Il numero di osservazioni attuali secondo i date: 50.
La fonte (nome):
Indicatori dello sviluppo mondiale
La fonte (organizzazione):
World Bank staff estimates based data from International Monetary Fund's Direction of Trade database.
Categorie:
Private Sector, Trade
sono stati aggiornati
23 apr 2017 anni
Indicatori delle variazioni dei valori per anni
Minima:
7.1
1 gen 1964 anni
Massimo:
44.031
1 gen 1969 anni
Alla data di osservazione
Valore
Variazione assoluta
La variazione rispetto al valore precedente
1 gen 1961 anni
22.343
+22.343
0.0%
1 gen 1963 anni
9.038
-13.304
-59.55%
1 gen 1964 anni
7.1
-1.938
-21.44%
1 gen 1969 anni
44.031
+36.931
520.14%
1 gen 1970 anni
41.747
-2.284
-5.19%
1 gen 1971 anni
35.441
-6.306
-15.1%
1 gen 1972 anni
36.377
+0.936
2.64%
1 gen 1973 anni
32.355
-4.022
-11.06%
1 gen 1974 anni
27.321
-5.034
-15.56%
1 gen 1975 anni
26.226
-1.095
-4.01%
1 gen 1976 anni
25.988
-0.238
-0.91%
1 gen 1977 anni
21.508
-4.48
-17.24%
1 gen 1978 anni
21.133
-0.376
-1.75%
1 gen 1979 anni
21.848
+0.715
3.38%
1 gen 1980 anni
23.392
+1.544
7.07%
1 gen 1981 anni
24.237
+0.845
3.61%
1 gen 1982 anni
23.945
-0.291
-1.2%
1 gen 1983 anni
25.851
+1.906
7.96%
1 gen 1984 anni
26.327
+0.476
1.84%
1 gen 1985 anni
24.161
-2.166
-8.23%
1 gen 1986 anni
23.554
-0.607
-2.51%
1 gen 1987 anni
22.834
-0.72
-3.06%
1 gen 1988 anni
23.188
+0.355
1.55%
1 gen 1989 anni
23.971
+0.782
3.37%
1 gen 1990 anni
24.077
+0.106
0.44%
1 gen 1991 anni
23.312
-0.765
-3.18%
1 gen 1992 anni
24.593
+1.28
5.49%
1 gen 1993 anni
23.594
-0.999
-4.06%
1 gen 1994 anni
26.905
+3.312
14.04%
1 gen 1995 anni
31.423
+4.517
16.79%
1 gen 1996 anni
31.708
+0.286
0.91%
1 gen 1997 anni
30.851
-0.858
-2.7%
1 gen 1998 anni
30.168
-0.683
-2.21%
1 gen 1999 anni
27.289
-2.88
-9.55%
1 gen 2000 anni
29.076
+1.788
6.55%
1 gen 2001 anni
31.179
+2.103
7.23%
1 gen 2002 anni
31.343
+0.164
0.53%
1 gen 2003 anni
32.627
+1.284
4.1%
1 gen 2004 anni
38.755
+6.129
18.78%
1 gen 2005 anni
39.408
+0.653
1.68%
1 gen 2006 anni
40.125
+0.717
1.82%
1 gen 2007 anni
40.713
+0.588
1.47%
1 gen 2008 anni
41.556
+0.843
2.07%
1 gen 2009 anni
41.445
-0.111
-0.27%
1 gen 2010 anni
40.058
-1.387
-3.35%
1 gen 2011 anni
40.743
+0.685
1.71%
1 gen 2012 anni
41.708
+0.965
2.37%
1 gen 2013 anni
42.721
+1.013
2.43%
1 gen 2014 anni
43.08
+0.359
0.84%
1 gen 2015 anni
43.741
+0.661
1.54%
Classificazione dei paesi secondo i statistiche attuali per anni


Commenti: