29
/it/
it
AIzaSyAYiBZKx7MnpbEhh9jyipgxe19OcubqV5w
April 1, 2024
157561
Iran, Islamic Rep.
IRN
true
2
1
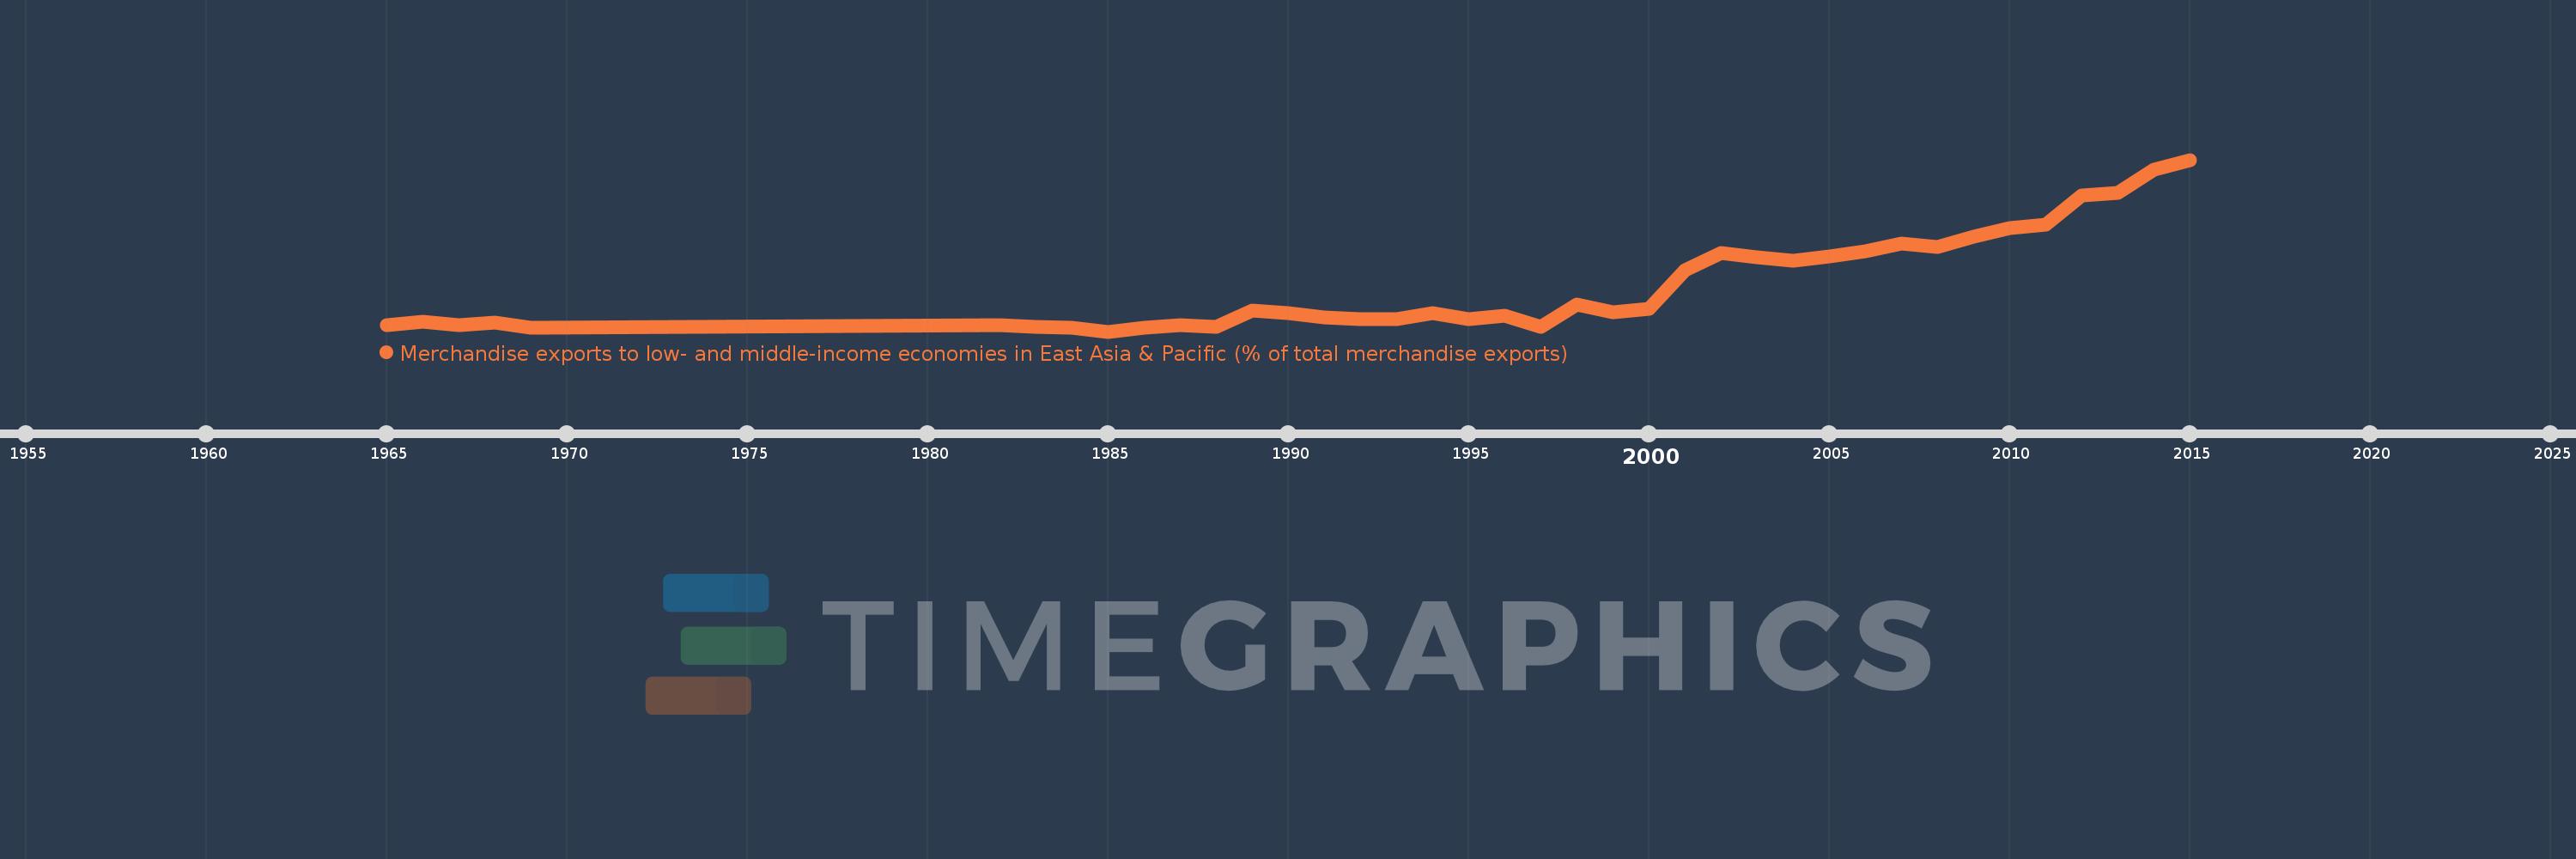
Merchandise exports to low- and middle-income economies in East Asia & Pacific (% of total merchandise exports)
2015,2014,2013,2012,2011,2010,2009,2008,2007,2006,2005,2004,2003,2002,2001,2000,1999,1998,1997,1996,1995,1994,1993,1992,1991,1990,1989,1988,1987,1986,1985,1984,1983,1982,1969,1968,1967,1966,1965
Queste statistiche in altri paesi:
AfghanistanAlbaniaAlgeriaArab WorldArgentinaAustraliaAustriaAzerbaijanBahamas, TheBahrainBangladeshBarbadosBelarusBelgiumBermudaBrazilBrunei DarussalamBulgariaCabo VerdeCambodiaCameroonCanadaCaribbean small statesCentral Europe and the BalticsChileChinaColombiaCosta RicaCote d'IvoireCroatiaCubaCyprusCzech RepublicDenmarkDominicaDominican RepublicEarly-demographic dividendEast Asia & PacificEast Asia & Pacific (excluding high income)East Asia & Pacific (IDA & IBRD countries)EcuadorEgypt, Arab Rep.El SalvadorEstoniaEthiopiaEuro areaEurope & Central AsiaEurope & Central Asia (excluding high income)Europe & Central Asia (IDA & IBRD countries)European UnionFijiFinlandFragile and conflict affected situationsFranceGermanyGhanaGreeceGuatemalaGuyanaHeavily indebted poor countries (HIPC)High incomeHondurasHong Kong SAR, ChinaHungaryIBRD onlyIcelandIDA & IBRD totalIDA blendIDA onlyIDA totalIndiaIndonesiaIran, Islamic Rep.IraqIrelandIsraelItalyJamaicaJapanJordanKazakhstanKenyaKorea, Dem. People’s Rep.Korea, Rep.KuwaitLate-demographic dividendLatin America & Caribbean Latin America & Caribbean (excluding high income)Latin America & the Caribbean (IDA & IBRD countries)LatviaLeast developed countries: UN classificationLebanonLithuaniaLow & middle incomeLow incomeLower middle incomeLuxembourgMacao SAR, ChinaMacedonia, FYRMadagascarMalaysiaMaltaMauritiusMexicoMiddle East & North AfricaMiddle East & North Africa (excluding high income)Middle East & North Africa (IDA & IBRD countries)Middle incomeMoldovaMontenegroMoroccoMozambiqueMyanmarNetherlandsNew CaledoniaNew ZealandNigeriaNorth AmericaNorwayOECD membersOmanOther small statesPacific island small statesPakistanPapua New GuineaParaguayPeruPhilippinesPolandPortugalPost-demographic dividendPre-demographic dividendQatarRomaniaRussian FederationSaudi ArabiaSenegalSerbiaSingaporeSlovak RepublicSloveniaSmall statesSolomon IslandsSomaliaSouth AfricaSouth AsiaSouth Asia (IDA & IBRD)SpainSri LankaSt. LuciaSub-Saharan Africa Sub-Saharan Africa (excluding high income)Sub-Saharan Africa (IDA & IBRD countries)SurinameSwedenSwitzerlandSyrian Arab RepublicTanzaniaThailandTogoTongaTrinidad and TobagoTunisiaTurkeyUgandaUkraineUnited Arab EmiratesUnited KingdomUnited StatesUpper middle incomeVenezuela, RBVietnamWorldYemen, Rep.ZambiaZimbabwe Linea del tempo:
Questa scala temporale mostra un grafico dal 1965 anno al 2015 anno. Iran, Islamic Rep.. I dati fino ad 1964 anno non disponibili. Il numero di osservazioni attuali secondo i date: 39.
La fonte (nome):
Indicatori dello sviluppo mondiale
La fonte (organizzazione):
World Bank staff estimates based data from International Monetary Fund's Direction of Trade database.
Categorie:
Private Sector, Trade
sono stati aggiornati
23 apr 2017 anni
Indicatori delle variazioni dei valori per anni
Minima:
0.004
1 gen 1985 anni
Massimo:
29.151
1 gen 2015 anni
Alla data di osservazione
Valore
Variazione assoluta
La variazione rispetto al valore precedente
1 gen 1965 anni
1.06
+1.06
0.0%
1 gen 1966 anni
1.685
+0.625
58.99%
1 gen 1967 anni
1.108
-0.577
-34.22%
1 gen 1968 anni
1.558
+0.449
40.52%
1 gen 1969 anni
0.588
-0.969
-62.22%
1 gen 1982 anni
1.029
+0.441
74.92%
1 gen 1983 anni
0.878
-0.151
-14.65%
1 gen 1984 anni
0.625
-0.254
-28.9%
1 gen 1985 anni
0.004
-0.62
-99.34%
1 gen 1986 anni
0.698
+0.694
16.96 Mille.%
1 gen 1987 anni
1.029
+0.331
47.38%
1 gen 1988 anni
0.778
-0.251
-24.42%
1 gen 1989 anni
3.586
+2.808
360.88%
1 gen 1990 anni
3.189
-0.397
-11.08%
1 gen 1991 anni
2.382
-0.806
-25.29%
1 gen 1992 anni
2.148
-0.234
-9.84%
1 gen 1993 anni
2.139
-0.009
-0.43%
1 gen 1994 anni
3.108
+0.97
45.35%
1 gen 1995 anni
2.146
-0.962
-30.95%
1 gen 1996 anni
2.685
+0.539
25.11%
1 gen 1997 anni
0.737
-1.948
-72.56%
1 gen 1998 anni
4.625
+3.888
527.62%
1 gen 1999 anni
3.35
-1.275
-27.58%
1 gen 2000 anni
3.873
+0.523
15.61%
1 gen 2001 anni
10.481
+6.609
170.66%
1 gen 2002 anni
13.395
+2.914
27.8%
1 gen 2003 anni
12.542
-0.853
-6.37%
1 gen 2004 anni
12.02
-0.522
-4.16%
1 gen 2005 anni
12.732
+0.711
5.92%
1 gen 2006 anni
13.658
+0.926
7.28%
1 gen 2007 anni
14.911
+1.253
9.17%
1 gen 2008 anni
14.431
-0.48
-3.22%
1 gen 2009 anni
16.137
+1.705
11.82%
1 gen 2010 anni
17.533
+1.396
8.65%
1 gen 2011 anni
18.178
+0.645
3.68%
1 gen 2012 anni
23.086
+4.908
27.0%
1 gen 2013 anni
23.537
+0.451
1.95%
1 gen 2014 anni
27.486
+3.95
16.78%
1 gen 2015 anni
29.151
+1.665
6.06%
Classificazione dei paesi secondo i statistiche attuali per anni


Commenti: