29
/it/
it
AIzaSyAYiBZKx7MnpbEhh9jyipgxe19OcubqV5w
April 1, 2024
226158
Portugal
PRT
true
2
1
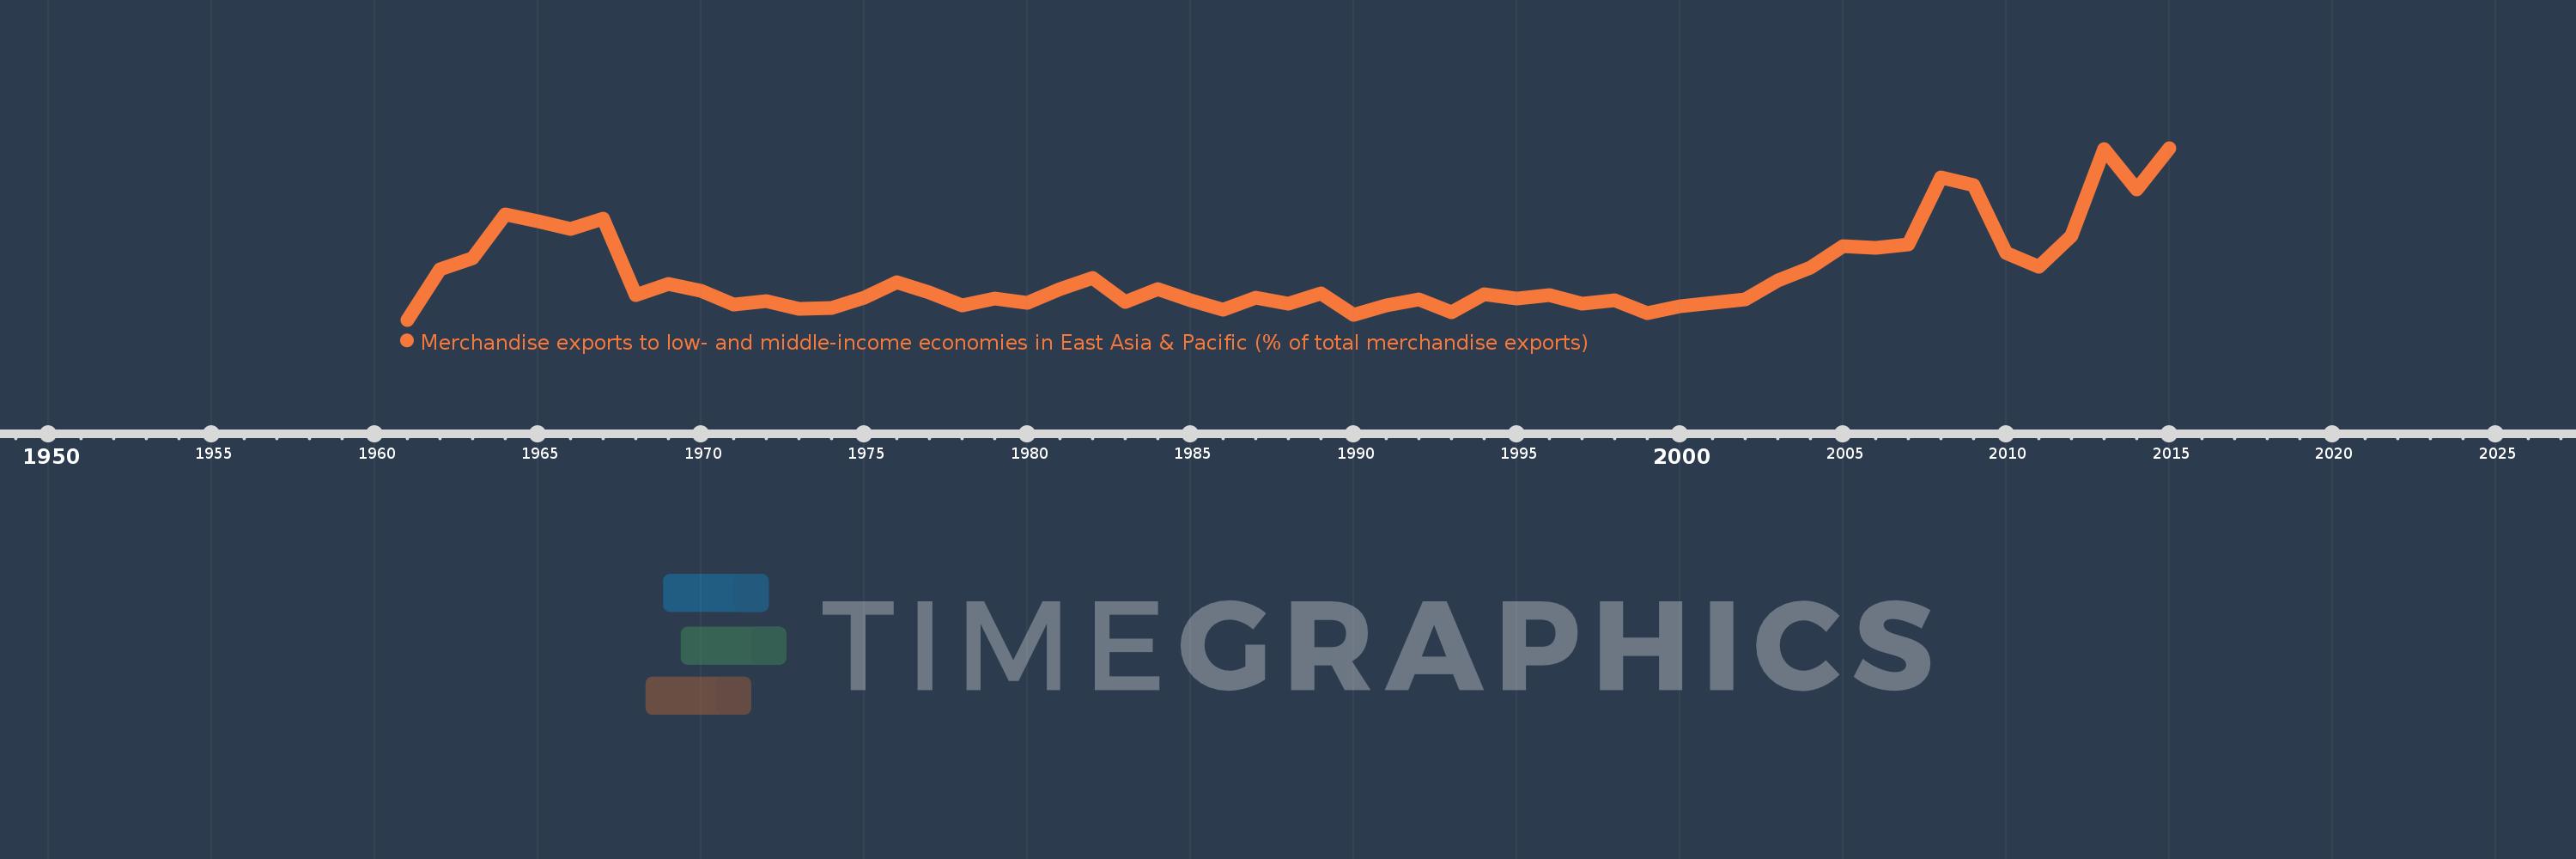
Merchandise exports to low- and middle-income economies in East Asia & Pacific (% of total merchandise exports)
2015,2014,2013,2012,2011,2010,2009,2008,2007,2006,2005,2004,2003,2002,2001,2000,1999,1998,1997,1996,1995,1994,1993,1992,1991,1990,1989,1988,1987,1986,1985,1984,1983,1982,1981,1980,1979,1978,1977,1976,1975,1974,1973,1972,1971,1970,1969,1968,1967,1966,1965,1964,1963,1962,1961
Queste statistiche in altri paesi:
AfghanistanAlbaniaAlgeriaArab WorldArgentinaAustraliaAustriaAzerbaijanBahamas, TheBahrainBangladeshBarbadosBelarusBelgiumBermudaBrazilBrunei DarussalamBulgariaCabo VerdeCambodiaCameroonCanadaCaribbean small statesCentral Europe and the BalticsChileChinaColombiaCosta RicaCote d'IvoireCroatiaCubaCyprusCzech RepublicDenmarkDominicaDominican RepublicEarly-demographic dividendEast Asia & PacificEast Asia & Pacific (excluding high income)East Asia & Pacific (IDA & IBRD countries)EcuadorEgypt, Arab Rep.El SalvadorEstoniaEthiopiaEuro areaEurope & Central AsiaEurope & Central Asia (excluding high income)Europe & Central Asia (IDA & IBRD countries)European UnionFijiFinlandFragile and conflict affected situationsFranceGermanyGhanaGreeceGuatemalaGuyanaHeavily indebted poor countries (HIPC)High incomeHondurasHong Kong SAR, ChinaHungaryIBRD onlyIcelandIDA & IBRD totalIDA blendIDA onlyIDA totalIndiaIndonesiaIran, Islamic Rep.IraqIrelandIsraelItalyJamaicaJapanJordanKazakhstanKenyaKorea, Dem. People’s Rep.Korea, Rep.KuwaitLate-demographic dividendLatin America & Caribbean Latin America & Caribbean (excluding high income)Latin America & the Caribbean (IDA & IBRD countries)LatviaLeast developed countries: UN classificationLebanonLithuaniaLow & middle incomeLow incomeLower middle incomeLuxembourgMacao SAR, ChinaMacedonia, FYRMadagascarMalaysiaMaltaMauritiusMexicoMiddle East & North AfricaMiddle East & North Africa (excluding high income)Middle East & North Africa (IDA & IBRD countries)Middle incomeMoldovaMontenegroMoroccoMozambiqueMyanmarNetherlandsNew CaledoniaNew ZealandNigeriaNorth AmericaNorwayOECD membersOmanOther small statesPacific island small statesPakistanPapua New GuineaParaguayPeruPhilippinesPolandPortugalPost-demographic dividendPre-demographic dividendQatarRomaniaRussian FederationSaudi ArabiaSenegalSerbiaSingaporeSlovak RepublicSloveniaSmall statesSolomon IslandsSomaliaSouth AfricaSouth AsiaSouth Asia (IDA & IBRD)SpainSri LankaSt. LuciaSub-Saharan Africa Sub-Saharan Africa (excluding high income)Sub-Saharan Africa (IDA & IBRD countries)SurinameSwedenSwitzerlandSyrian Arab RepublicTanzaniaThailandTogoTongaTrinidad and TobagoTunisiaTurkeyUgandaUkraineUnited Arab EmiratesUnited KingdomUnited StatesUpper middle incomeVenezuela, RBVietnamWorldYemen, Rep.ZambiaZimbabwe Linea del tempo:
Questa scala temporale mostra un grafico dal 1961 anno al 2015 anno. Portugal. I dati fino ad 1960 anno non disponibili. Il numero di osservazioni attuali secondo i date: 55.
La fonte (nome):
Indicatori dello sviluppo mondiale
La fonte (organizzazione):
World Bank staff estimates based data from International Monetary Fund's Direction of Trade database.
Categorie:
Private Sector, Trade
sono stati aggiornati
23 apr 2017 anni
Indicatori delle variazioni dei valori per anni
Minima:
0.247
1 gen 1961 anni
Massimo:
1.887
1 gen 2015 anni
Alla data di osservazione
Valore
Variazione assoluta
La variazione rispetto al valore precedente
1 gen 1961 anni
0.247
+0.247
0.0%
1 gen 1962 anni
0.728
+0.481
194.89%
1 gen 1963 anni
0.832
+0.104
14.3%
1 gen 1964 anni
1.257
+0.425
51.08%
1 gen 1965 anni
1.185
-0.072
-5.73%
1 gen 1966 anni
1.112
-0.073
-6.15%
1 gen 1967 anni
1.213
+0.101
9.1%
1 gen 1968 anni
0.482
-0.731
-60.25%
1 gen 1969 anni
0.59
+0.108
22.43%
1 gen 1970 anni
0.526
-0.064
-10.83%
1 gen 1971 anni
0.391
-0.135
-25.64%
1 gen 1972 anni
0.421
+0.029
7.51%
1 gen 1973 anni
0.353
-0.068
-16.13%
1 gen 1974 anni
0.359
+0.007
1.84%
1 gen 1975 anni
0.456
+0.097
26.96%
1 gen 1976 anni
0.608
+0.151
33.17%
1 gen 1977 anni
0.51
-0.097
-16.01%
1 gen 1978 anni
0.381
-0.129
-25.37%
1 gen 1979 anni
0.452
+0.071
18.63%
1 gen 1980 anni
0.408
-0.044
-9.68%
1 gen 1981 anni
0.543
+0.135
33.09%
1 gen 1982 anni
0.647
+0.104
19.2%
1 gen 1983 anni
0.42
-0.227
-35.06%
1 gen 1984 anni
0.542
+0.122
28.93%
1 gen 1985 anni
0.435
-0.107
-19.69%
1 gen 1986 anni
0.345
-0.09
-20.74%
1 gen 1987 anni
0.456
+0.111
32.1%
1 gen 1988 anni
0.399
-0.057
-12.41%
1 gen 1989 anni
0.496
+0.096
24.13%
1 gen 1990 anni
0.296
-0.2
-40.36%
1 gen 1991 anni
0.381
+0.086
29.05%
1 gen 1992 anni
0.445
+0.064
16.71%
1 gen 1993 anni
0.316
-0.129
-29.04%
1 gen 1994 anni
0.493
+0.177
56.17%
1 gen 1995 anni
0.449
-0.045
-9.03%
1 gen 1996 anni
0.486
+0.037
8.23%
1 gen 1997 anni
0.398
-0.087
-18.01%
1 gen 1998 anni
0.434
+0.035
8.9%
1 gen 1999 anni
0.307
-0.126
-29.11%
1 gen 2000 anni
0.374
+0.067
21.76%
1 gen 2001 anni
0.406
+0.031
8.35%
1 gen 2002 anni
0.439
+0.033
8.24%
1 gen 2003 anni
0.619
+0.18
41.05%
1 gen 2004 anni
0.745
+0.126
20.31%
1 gen 2005 anni
0.946
+0.201
27.02%
1 gen 2006 anni
0.934
-0.012
-1.24%
1 gen 2007 anni
0.968
+0.034
3.62%
1 gen 2008 anni
1.608
+0.64
66.12%
1 gen 2009 anni
1.53
-0.079
-4.89%
1 gen 2010 anni
0.881
-0.649
-42.39%
1 gen 2011 anni
0.752
-0.13
-14.71%
1 gen 2012 anni
1.046
+0.294
39.14%
1 gen 2013 anni
1.88
+0.834
79.77%
1 gen 2014 anni
1.494
-0.386
-20.55%
1 gen 2015 anni
1.887
+0.393
26.3%
Classificazione dei paesi secondo i statistiche attuali per anni


Commenti: