29
/it/
it
AIzaSyAYiBZKx7MnpbEhh9jyipgxe19OcubqV5w
April 1, 2024
221805
Peru
PER
true
2
1
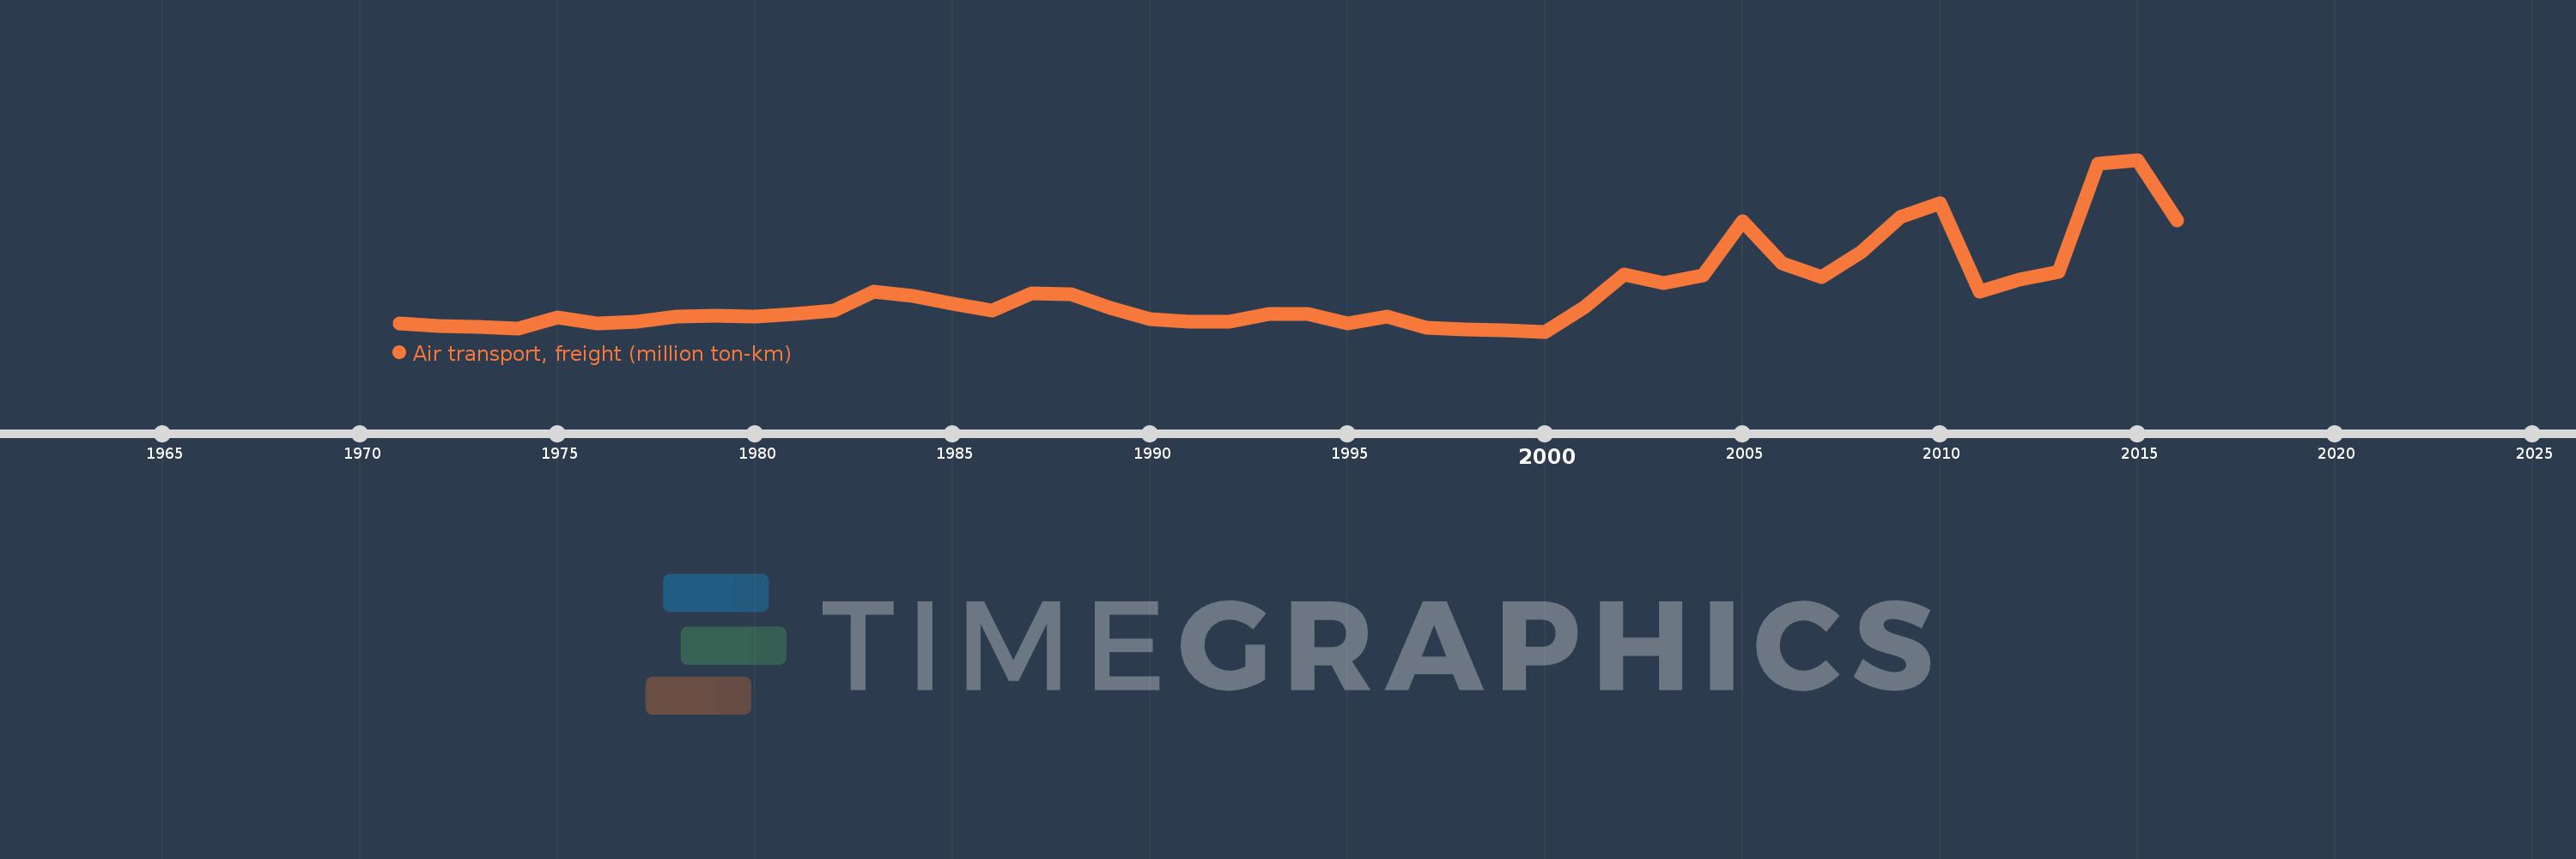
Air transport, freight (million ton-km)
2016,2015,2014,2013,2012,2011,2010,2009,2008,2007,2006,2005,2004,2003,2002,2001,2000,1999,1998,1997,1996,1995,1994,1993,1992,1991,1990,1989,1988,1987,1986,1985,1984,1983,1982,1981,1980,1979,1978,1977,1976,1975,1974,1973,1972,1971
Queste statistiche in altri paesi:
AfghanistanAlbaniaAlgeriaAmerican SamoaAngolaAntigua and BarbudaArab WorldArgentinaArmeniaAustraliaAustriaAzerbaijanBahamas, TheBahrainBangladeshBarbadosBelarusBelgiumBelizeBeninBhutanBoliviaBosnia and HerzegovinaBotswanaBrazilBrunei DarussalamBulgariaBurkina FasoBurundiCabo VerdeCambodiaCameroonCanadaCaribbean small statesCentral African RepublicCentral Europe and the BalticsChadChileChinaColombiaComorosCongo, Dem. Rep.Congo, Rep.Costa RicaCote d'IvoireCroatiaCubaCyprusCzech RepublicDenmarkDjiboutiDominican RepublicEarly-demographic dividendEast Asia & PacificEast Asia & Pacific (excluding high income)East Asia & Pacific (IDA & IBRD countries)EcuadorEgypt, Arab Rep.El SalvadorEquatorial GuineaEritreaEstoniaEthiopiaEuro areaEurope & Central AsiaEurope & Central Asia (excluding high income)Europe & Central Asia (IDA & IBRD countries)European UnionFijiFinlandFragile and conflict affected situationsFranceGabonGambia, TheGeorgiaGermanyGhanaGreeceGuamGuatemalaGuineaGuinea-BissauGuyanaHaitiHeavily indebted poor countries (HIPC)High incomeHondurasHong Kong SAR, ChinaHungaryIBRD onlyIcelandIDA & IBRD totalIDA blendIDA onlyIDA totalIndiaIndonesiaIran, Islamic Rep.IraqIrelandIsraelItalyJamaicaJapanJordanKazakhstanKenyaKiribatiKorea, Dem. People’s Rep.Korea, Rep.KuwaitKyrgyz RepublicLao PDRLate-demographic dividendLatin America & Caribbean Latin America & Caribbean (excluding high income)Latin America & the Caribbean (IDA & IBRD countries)LatviaLeast developed countries: UN classificationLebanonLesothoLiberiaLibyaLithuaniaLow & middle incomeLow incomeLower middle incomeLuxembourgMacao SAR, ChinaMacedonia, FYRMadagascarMalawiMalaysiaMaldivesMaliMaltaMarshall IslandsMauritaniaMauritiusMexicoMiddle East & North AfricaMiddle East & North Africa (excluding high income)Middle East & North Africa (IDA & IBRD countries)Middle incomeMoldovaMonacoMongoliaMontenegroMoroccoMozambiqueMyanmarNamibiaNauruNepalNetherlandsNew ZealandNicaraguaNigerNigeriaNorth AmericaNorwayOECD membersOmanOther small statesPacific island small statesPakistanPanamaPapua New GuineaParaguayPeruPhilippinesPolandPortugalPost-demographic dividendPre-demographic dividendQatarRomaniaRussian FederationRwandaSamoaSao Tome and PrincipeSaudi ArabiaSenegalSerbiaSeychellesSierra LeoneSingaporeSlovak RepublicSloveniaSmall statesSolomon IslandsSomaliaSouth AfricaSouth AsiaSouth Asia (IDA & IBRD)SpainSri LankaSub-Saharan Africa Sub-Saharan Africa (excluding high income)Sub-Saharan Africa (IDA & IBRD countries)SudanSurinameSwazilandSwedenSwitzerlandSyrian Arab RepublicTajikistanTanzaniaThailandTogoTongaTrinidad and TobagoTunisiaTurkeyTurkmenistanUgandaUkraineUnited Arab EmiratesUnited KingdomUnited StatesUpper middle incomeUruguayUzbekistanVanuatuVenezuela, RBVietnamWorldYemen, Rep.ZambiaZimbabwe Linea del tempo:
Questa scala temporale mostra un grafico dal 1971 anno al 2016 anno. Peru. I dati fino ad 1970 anno non disponibili. Il numero di osservazioni attuali secondo i date: 46.
La fonte (nome):
Indicatori dello sviluppo mondiale
La fonte (organizzazione):
International Civil Aviation Organization, Civil Aviation Statistics of the World and ICAO staff estimates.
Categorie:
Infrastructure
sono stati aggiornati
23 apr 2017 anni
Indicatori delle variazioni dei valori per anni
Minima:
6.0
1 gen 2000 anni
Massimo:
341.775
1 gen 2015 anni
Alla data di osservazione
Valore
Variazione assoluta
La variazione rispetto al valore precedente
1 gen 1971 anni
22.4
+22.4
0.0%
1 gen 1972 anni
17.3
-5.1
-22.77%
1 gen 1973 anni
15.9
-1.4
-8.09%
1 gen 1974 anni
12.3
-3.6
-22.64%
1 gen 1975 anni
34.4
+22.1
179.67%
1 gen 1976 anni
22.3
-12.1
-35.17%
1 gen 1977 anni
25.1
+2.8
12.56%
1 gen 1978 anni
34.8
+9.7
38.65%
1 gen 1979 anni
37.7
+2.9
8.33%
1 gen 1980 anni
35.7
-2.0
-5.31%
1 gen 1981 anni
40.1
+4.4
12.32%
1 gen 1982 anni
47.6
+7.5
18.7%
1 gen 1983 anni
83.3
+35.7
75.0%
1 gen 1984 anni
75.7
-7.6
-9.12%
1 gen 1985 anni
61.0
-14.7
-19.42%
1 gen 1986 anni
47.4
-13.6
-22.3%
1 gen 1987 anni
80.1
+32.7
68.99%
1 gen 1988 anni
78.7
-1.4
-1.75%
1 gen 1989 anni
52.1
-26.6
-33.8%
1 gen 1990 anni
30.2
-21.9
-42.03%
1 gen 1991 anni
25.6
-4.6
-15.23%
1 gen 1992 anni
25.0
-0.6
-2.34%
1 gen 1993 anni
40.5
+15.5
62.0%
1 gen 1994 anni
40.1
-0.4
-0.99%
1 gen 1995 anni
22.4
-17.7
-44.14%
1 gen 1996 anni
34.6
+12.2
54.46%
1 gen 1997 anni
14.1
-20.5
-59.25%
1 gen 1998 anni
9.5
-4.6
-32.62%
1 gen 1999 anni
8.7
-0.8
-8.42%
1 gen 2000 anni
6.0
-2.7
-31.03%
1 gen 2001 anni
53.662
+47.662
794.37%
1 gen 2002 anni
117.132
+63.47
118.28%
1 gen 2003 anni
100.417
-16.715
-14.27%
1 gen 2004 anni
116.0
+15.583
15.52%
1 gen 2005 anni
221.044
+105.044
90.56%
1 gen 2006 anni
138.691
-82.353
-37.26%
1 gen 2007 anni
112.233
-26.458
-19.08%
1 gen 2008 anni
161.576
+49.343
43.96%
1 gen 2009 anni
230.125
+68.549
42.43%
1 gen 2010 anni
256.939
+26.814
11.65%
1 gen 2011 anni
83.58
-173.359
-67.47%
1 gen 2012 anni
107.179
+23.599
28.23%
1 gen 2013 anni
122.151
+14.972
13.97%
1 gen 2014 anni
334.88
+212.729
174.15%
1 gen 2015 anni
341.775
+6.894
2.06%
1 gen 2016 anni
223.643
-118.131
-34.56%
Classificazione dei paesi secondo i statistiche attuali per anni


Commenti: