29
/it/
it
AIzaSyAYiBZKx7MnpbEhh9jyipgxe19OcubqV5w
April 1, 2024
195169
Mexico
MEX
true
2
1
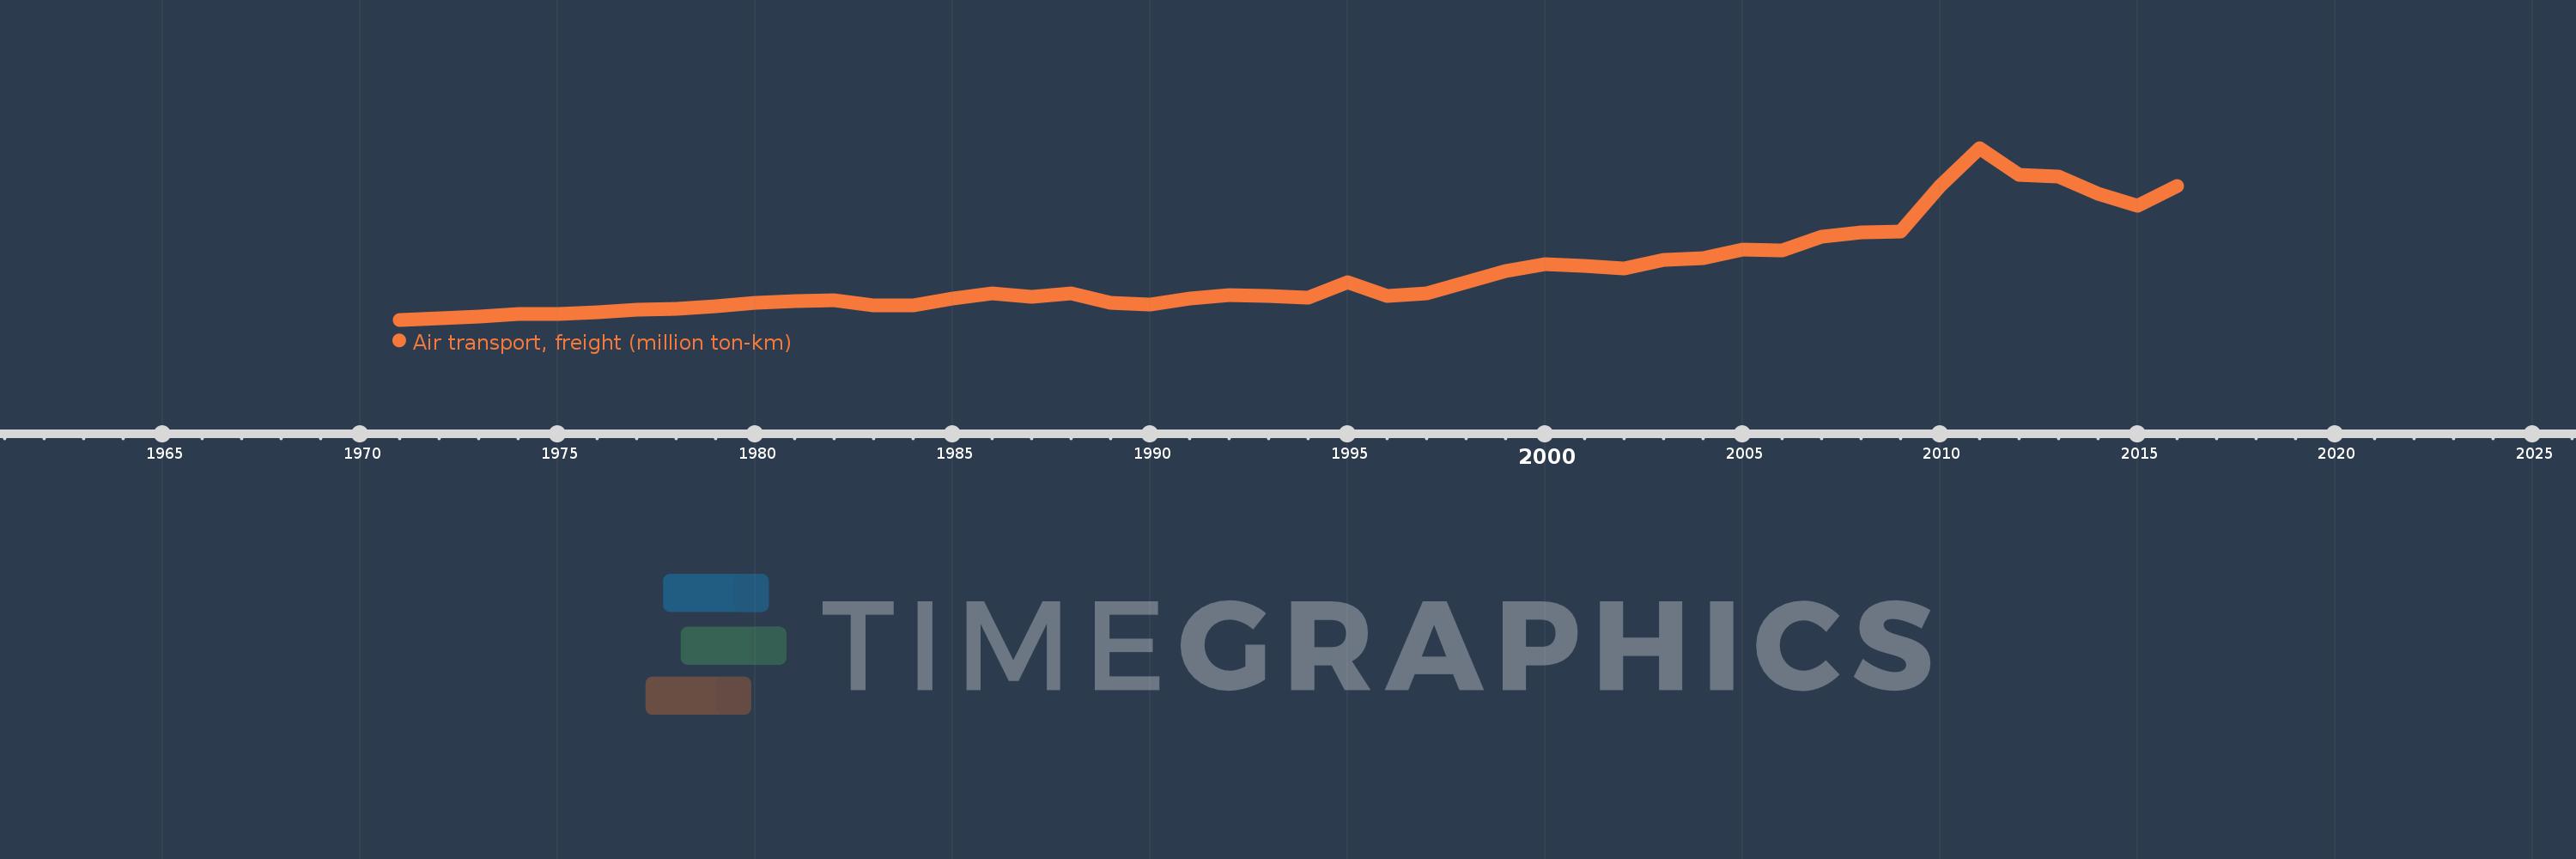
Air transport, freight (million ton-km)
2016,2015,2014,2013,2012,2011,2010,2009,2008,2007,2006,2005,2004,2003,2002,2001,2000,1999,1998,1997,1996,1995,1994,1993,1992,1991,1990,1989,1988,1987,1986,1985,1984,1983,1982,1981,1980,1979,1978,1977,1976,1975,1974,1973,1972,1971
Queste statistiche in altri paesi:
AfghanistanAlbaniaAlgeriaAmerican SamoaAngolaAntigua and BarbudaArab WorldArgentinaArmeniaAustraliaAustriaAzerbaijanBahamas, TheBahrainBangladeshBarbadosBelarusBelgiumBelizeBeninBhutanBoliviaBosnia and HerzegovinaBotswanaBrazilBrunei DarussalamBulgariaBurkina FasoBurundiCabo VerdeCambodiaCameroonCanadaCaribbean small statesCentral African RepublicCentral Europe and the BalticsChadChileChinaColombiaComorosCongo, Dem. Rep.Congo, Rep.Costa RicaCote d'IvoireCroatiaCubaCyprusCzech RepublicDenmarkDjiboutiDominican RepublicEarly-demographic dividendEast Asia & PacificEast Asia & Pacific (excluding high income)East Asia & Pacific (IDA & IBRD countries)EcuadorEgypt, Arab Rep.El SalvadorEquatorial GuineaEritreaEstoniaEthiopiaEuro areaEurope & Central AsiaEurope & Central Asia (excluding high income)Europe & Central Asia (IDA & IBRD countries)European UnionFijiFinlandFragile and conflict affected situationsFranceGabonGambia, TheGeorgiaGermanyGhanaGreeceGuamGuatemalaGuineaGuinea-BissauGuyanaHaitiHeavily indebted poor countries (HIPC)High incomeHondurasHong Kong SAR, ChinaHungaryIBRD onlyIcelandIDA & IBRD totalIDA blendIDA onlyIDA totalIndiaIndonesiaIran, Islamic Rep.IraqIrelandIsraelItalyJamaicaJapanJordanKazakhstanKenyaKiribatiKorea, Dem. People’s Rep.Korea, Rep.KuwaitKyrgyz RepublicLao PDRLate-demographic dividendLatin America & Caribbean Latin America & Caribbean (excluding high income)Latin America & the Caribbean (IDA & IBRD countries)LatviaLeast developed countries: UN classificationLebanonLesothoLiberiaLibyaLithuaniaLow & middle incomeLow incomeLower middle incomeLuxembourgMacao SAR, ChinaMacedonia, FYRMadagascarMalawiMalaysiaMaldivesMaliMaltaMarshall IslandsMauritaniaMauritiusMexicoMiddle East & North AfricaMiddle East & North Africa (excluding high income)Middle East & North Africa (IDA & IBRD countries)Middle incomeMoldovaMonacoMongoliaMontenegroMoroccoMozambiqueMyanmarNamibiaNauruNepalNetherlandsNew ZealandNicaraguaNigerNigeriaNorth AmericaNorwayOECD membersOmanOther small statesPacific island small statesPakistanPanamaPapua New GuineaParaguayPeruPhilippinesPolandPortugalPost-demographic dividendPre-demographic dividendQatarRomaniaRussian FederationRwandaSamoaSao Tome and PrincipeSaudi ArabiaSenegalSerbiaSeychellesSierra LeoneSingaporeSlovak RepublicSloveniaSmall statesSolomon IslandsSomaliaSouth AfricaSouth AsiaSouth Asia (IDA & IBRD)SpainSri LankaSub-Saharan Africa Sub-Saharan Africa (excluding high income)Sub-Saharan Africa (IDA & IBRD countries)SudanSurinameSwazilandSwedenSwitzerlandSyrian Arab RepublicTajikistanTanzaniaThailandTogoTongaTrinidad and TobagoTunisiaTurkeyTurkmenistanUgandaUkraineUnited Arab EmiratesUnited KingdomUnited StatesUpper middle incomeUruguayUzbekistanVanuatuVenezuela, RBVietnamWorldYemen, Rep.ZambiaZimbabwe Linea del tempo:
Questa scala temporale mostra un grafico dal 1971 anno al 2016 anno. Mexico. I dati fino ad 1970 anno non disponibili. Il numero di osservazioni attuali secondo i date: 46.
La fonte (nome):
Indicatori dello sviluppo mondiale
La fonte (organizzazione):
International Civil Aviation Organization, Civil Aviation Statistics of the World and ICAO staff estimates.
Categorie:
Infrastructure
sono stati aggiornati
23 apr 2017 anni
Indicatori delle variazioni dei valori per anni
Minima:
36.7
1 gen 1971 anni
Massimo:
908.948
1 gen 2011 anni
Alla data di osservazione
Valore
Variazione assoluta
La variazione rispetto al valore precedente
1 gen 1971 anni
36.7
+36.7
0.0%
1 gen 1972 anni
42.4
+5.7
15.53%
1 gen 1973 anni
54.3
+11.9
28.07%
1 gen 1974 anni
67.6
+13.3
24.49%
1 gen 1975 anni
67.5
-0.1
-0.15%
1 gen 1976 anni
76.2
+8.7
12.89%
1 gen 1977 anni
87.1
+10.9
14.3%
1 gen 1978 anni
92.3
+5.2
5.97%
1 gen 1979 anni
106.1
+13.8
14.95%
1 gen 1980 anni
121.7
+15.6
14.7%
1 gen 1981 anni
131.5
+9.8
8.05%
1 gen 1982 anni
137.0
+5.5
4.18%
1 gen 1983 anni
110.6
-26.4
-19.27%
1 gen 1984 anni
109.2
-1.4
-1.27%
1 gen 1985 anni
145.8
+36.6
33.52%
1 gen 1986 anni
170.0
+24.2
16.6%
1 gen 1987 anni
155.1
-14.9
-8.76%
1 gen 1988 anni
169.0
+13.9
8.96%
1 gen 1989 anni
121.5
-47.5
-28.11%
1 gen 1990 anni
114.4
-7.1
-5.84%
1 gen 1991 anni
143.2
+28.8
25.17%
1 gen 1992 anni
162.7
+19.5
13.62%
1 gen 1993 anni
158.8
-3.9
-2.4%
1 gen 1994 anni
150.9
-7.9
-4.97%
1 gen 1995 anni
225.2
+74.3
49.24%
1 gen 1996 anni
155.9
-69.3
-30.77%
1 gen 1997 anni
168.8
+12.9
8.27%
1 gen 1998 anni
227.2
+58.4
34.6%
1 gen 1999 anni
284.8
+57.6
25.35%
1 gen 2000 anni
317.0
+32.2
11.31%
1 gen 2001 anni
309.858
-7.142
-2.25%
1 gen 2002 anni
295.884
-13.974
-4.51%
1 gen 2003 anni
341.598
+45.714
15.45%
1 gen 2004 anni
350.089
+8.491
2.49%
1 gen 2005 anni
394.925
+44.836
12.81%
1 gen 2006 anni
390.425
-4.5
-1.14%
1 gen 2007 anni
456.958
+66.533
17.04%
1 gen 2008 anni
482.34
+25.382
5.55%
1 gen 2009 anni
482.785
+0.445
0.09%
1 gen 2010 anni
714.057
+231.272
47.9%
1 gen 2011 anni
908.948
+194.891
27.29%
1 gen 2012 anni
774.604
-134.345
-14.78%
1 gen 2013 anni
763.886
-10.717
-1.38%
1 gen 2014 anni
677.14
-86.746
-11.36%
1 gen 2015 anni
617.53
-59.61
-8.8%
1 gen 2016 anni
713.985
+96.456
15.62%
Classificazione dei paesi secondo i statistiche attuali per anni


Commenti: